TECHNICAL ASSET FINGERPRINT
0c3f3818a4051a2c17976252
Click to view fullscreen
Press ESC or click to close
FOUND IN PAPERS
EXPERT: healer-alpha-free VERSION 1
RUNTIME: free/openrouter/healer-alpha
INTEL_VERIFIED
## Multi-Panel Chart: Reinforcement Learning Performance Analysis
### Overview
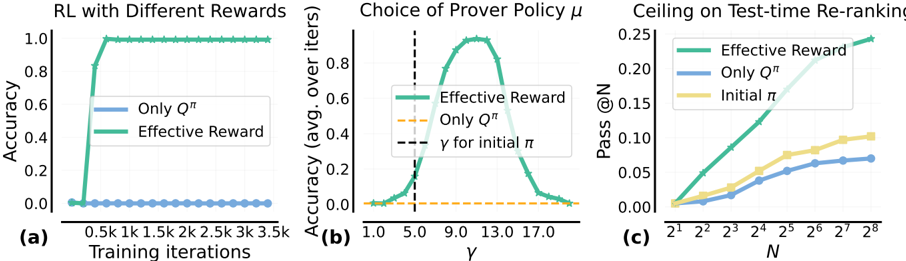
The image contains three horizontally arranged subplots, labeled (a), (b), and (c), presenting results from reinforcement learning (RL) experiments. The charts compare the performance of different reward/policy methods: "Only Q^π", "Effective Reward", and in one case, "Initial π". The overall theme is evaluating the effectiveness of a proposed "Effective Reward" method against baselines.
### Components/Axes
**Common Elements:**
* **Legends:** Each plot contains a legend box identifying the data series by color and line style.
* **Color Scheme:** A consistent color scheme is used across plots: Green for "Effective Reward", Blue for "Only Q^π", and Yellow for "Initial π".
**Plot (a): RL with Different Rewards**
* **Title:** "RL with Different Rewards"
* **X-axis:** Label: "Training iterations". Scale: Linear, with major ticks at 0.5k, 1k, 1.5k, 2k, 2.5k, 3k, 3.5k.
* **Y-axis:** Label: "Accuracy". Scale: Linear, from 0.0 to 1.0.
* **Legend:** Located in the center-left. Contains:
* Blue line: "Only Q^π"
* Green line: "Effective Reward"
**Plot (b): Choice of Prover Policy μ**
* **Title:** "Choice of Prover Policy μ"
* **X-axis:** Label: "γ" (gamma). Scale: Linear, with major ticks at 1.0, 5.0, 9.0, 13.0, 17.0.
* **Y-axis:** Label: "Accuracy (avg. over iters.)". Scale: Linear, from 0.0 to 0.8.
* **Legend:** Located in the center-left. Contains:
* Green line: "Effective Reward"
* Orange dashed line: "Only Q^π"
* Black vertical dashed line: "γ for initial π"
* **Additional Annotation:** A vertical black dashed line intersects the x-axis at γ = 5.0, labeled "γ for initial π".
**Plot (c): Ceiling on Test-time Re-ranking**
* **Title:** "Ceiling on Test-time Re-ranking"
* **X-axis:** Label: "N". Scale: Logarithmic (base 2), with major ticks at 2¹, 2², 2³, 2⁴, 2⁵, 2⁶, 2⁷, 2⁸.
* **Y-axis:** Label: "Pass @N". Scale: Linear, from 0.00 to 0.25.
* **Legend:** Located in the top-right. Contains:
* Green line: "Effective Reward"
* Blue line: "Only Q^π"
* Yellow line: "Initial π"
### Detailed Analysis
**Plot (a) Analysis:**
* **Trend - "Only Q^π" (Blue):** The line remains flat at approximately 0.0 accuracy across all training iterations from 0 to 3.5k.
* **Trend - "Effective Reward" (Green):** The line shows a sharp, near-vertical increase from ~0.0 to 1.0 accuracy between 0 and 0.5k iterations. It then plateaus perfectly at 1.0 for the remainder of the training (0.5k to 3.5k iterations).
* **Data Points (Approximate):**
* Iteration 0: Both methods ~0.0.
* Iteration 0.5k: "Effective Reward" ≈ 1.0, "Only Q^π" ≈ 0.0.
* Iterations 1k-3.5k: "Effective Reward" = 1.0, "Only Q^π" ≈ 0.0.
**Plot (b) Analysis:**
* **Trend - "Effective Reward" (Green):** The line forms a clear bell-shaped curve (inverted U). Accuracy starts near 0.0 at γ=1.0, rises to a peak, and then falls back towards 0.0 by γ=17.0.
* **Trend - "Only Q^π" (Orange Dashed):** The line is flat at approximately 0.0 accuracy across the entire γ range.
* **Key Marker:** The vertical line "γ for initial π" is at γ=5.0, where the "Effective Reward" accuracy is still low but beginning its ascent.
* **Data Points (Approximate):**
* Peak of "Effective Reward" curve: Occurs at approximately γ = 9.0 to 11.0, with a maximum accuracy of ~0.75.
* γ = 5.0: "Effective Reward" accuracy ≈ 0.1.
* γ = 1.0 and γ = 17.0: "Effective Reward" accuracy ≈ 0.0.
**Plot (c) Analysis:**
* **Trend - All Lines:** All three lines show a positive, monotonic trend, increasing as N increases on the logarithmic scale.
* **Relative Performance:** The "Effective Reward" (Green) line is consistently the highest, followed by "Initial π" (Yellow), with "Only Q^π" (Blue) being the lowest.
* **Data Points (Approximate Pass @N):**
* At N=2¹ (2): Green ≈ 0.02, Yellow ≈ 0.01, Blue ≈ 0.005.
* At N=2⁴ (16): Green ≈ 0.12, Yellow ≈ 0.06, Blue ≈ 0.04.
* At N=2⁸ (256): Green ≈ 0.24, Yellow ≈ 0.11, Blue ≈ 0.07.
### Key Observations
1. **Dominance of "Effective Reward":** The "Effective Reward" method outperforms the "Only Q^π" baseline in every presented metric: final accuracy (a), sensitivity to policy parameter γ (b), and test-time re-ranking performance (c).
2. **Catastrophic Failure of Baseline:** The "Only Q^π" method shows near-zero accuracy in both training (a) and across the policy parameter sweep (b), indicating it fails completely in this experimental setup.
3. **Optimal Policy Parameter:** Plot (b) reveals a clear optimal range for the prover policy parameter γ (around 9-11) for the "Effective Reward" method, with performance degrading significantly outside this range.
4. **Performance Ceiling:** Plot (c) suggests that while all methods improve with more re-ranking candidates (N), the "Effective Reward" method has a higher performance ceiling, achieving a Pass@N of ~0.24 at N=256 compared to ~0.11 for "Initial π".
### Interpretation
The data collectively demonstrates the significant superiority of the proposed "Effective Reward" framework over a baseline that relies solely on Q-values ("Only Q^π"). The experiments are designed to test different facets of performance:
* **Plot (a)** shows **learning efficiency and final capability**. "Effective Reward" learns a perfect policy extremely quickly, while the baseline fails to learn anything.
* **Plot (b)** investigates **hyperparameter sensitivity**. It shows that the success of "Effective Reward" is contingent on properly tuning the prover policy parameter γ, with a well-defined optimum. The baseline is insensitive because it doesn't work at all.
* **Plot (c)** evaluates **practical, test-time performance**. It confirms that the advantages of "Effective Reward" translate to better outcomes in a re-ranking scenario, with the gap between methods widening as the system is allowed more attempts (higher N).
The "Initial π" in plot (c) likely represents a non-learned or starting policy. The fact that "Effective Reward" surpasses it indicates successful learning, while "Only Q^π" performing worse than the initial policy suggests its learning process is detrimental. The overarching conclusion is that the "Effective Reward" mechanism provides a crucial and effective learning signal that is absent in the "Only Q^π" approach.
DECODING INTELLIGENCE...