## Composite Graph: RL Performance Analysis Across Training and Testing
### Overview
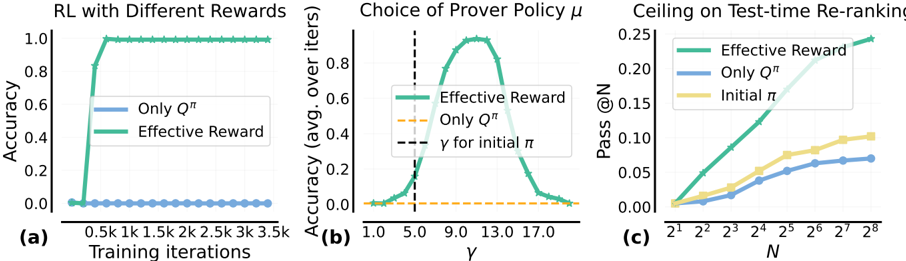
The image presents three subplots analyzing reinforcement learning (RL) performance metrics across different training iterations, policy choices, and test-time re-ranking scenarios. Each subplot compares multiple data series using distinct line styles and colors.
### Components/Axes
#### Subplot (a): RL with Different Rewards
- **X-axis**: Training iterations (0.5k to 3.5k)
- **Y-axis**: Accuracy (0.0 to 1.0)
- **Legend**:
- Blue (solid): "Only Qπ"
- Green (solid): "Effective Reward"
- **Legend Position**: Top-right corner
#### Subplot (b): Choice of Prover Policy μ
- **X-axis**: γ (1.0 to 17.0)
- **Y-axis**: Accuracy (avg. over iters) (0.0 to 0.8)
- **Legend**:
- Green (solid): "Effective Reward"
- Orange (dashed): "Only Qπ"
- Black (dashed): "γ for initial π"
- **Legend Position**: Top-right corner
#### Subplot (c): Ceiling on Test-time Re-ranking
- **X-axis**: N (2¹ to 2⁸)
- **Y-axis**: Pass @N (0.0 to 0.25)
- **Legend**:
- Green (solid): "Effective Reward"
- Blue (solid): "Only Qπ"
- Yellow (solid): "Initial π"
- **Legend Position**: Top-right corner
### Detailed Analysis
#### Subplot (a)
- **Trend Verification**:
- Green line ("Effective Reward") rapidly ascends to 1.0 accuracy within 0.5k iterations and plateaus.
- Blue line ("Only Qπ") remains at 0.0 accuracy throughout training.
- **Key Data Points**:
- Effective Reward: 0.0 → 1.0 (0.5k iterations)
- Only Qπ: 0.0 (all iterations)
#### Subplot (b)
- **Trend Verification**:
- Green line ("Effective Reward") peaks at γ=9.0 with ~0.8 accuracy.
- Orange line ("Only Qπ") remains flat at ~0.0 accuracy.
- Black dashed line ("γ for initial π") intersects at γ=5.0.
- **Key Data Points**:
- Effective Reward peak: γ=9.0, 0.8 accuracy
- Initial π γ: 5.0
#### Subplot (c)
- **Trend Verification**:
- Green line ("Effective Reward") shows exponential growth, reaching ~0.25 Pass @N at N=2⁸.
- Blue line ("Only Qπ") grows linearly, reaching ~0.10 Pass @N at N=2⁸.
- Yellow line ("Initial π") shows minimal growth, plateauing at ~0.05 Pass @N.
- **Key Data Points**:
- Effective Reward: 0.0 → 0.25 (N=2¹ → 2⁸)
- Only Qπ: 0.0 → 0.10 (N=2¹ → 2⁸)
- Initial π: 0.0 → 0.05 (N=2¹ → 2⁸)
### Key Observations
1. **Subplot (a)**: Effective Reward achieves perfect accuracy (1.0) within 0.5k iterations, while "Only Qπ" fails entirely.
2. **Subplot (b)**: Optimal γ for Effective Reward (9.0) exceeds the initial policy's γ (5.0), suggesting policy refinement improves performance.
3. **Subplot (c)**: Effective Reward scales better with larger N, maintaining a 2.5× higher Pass @N than "Only Qπ" and 5× higher than "Initial π" at N=2⁸.
### Interpretation
The data demonstrates that:
- **Reward Design**: Effective Reward significantly outperforms baseline methods (Qπ alone) in training efficiency and final performance.
- **Policy Tuning**: Adjusting γ (from initial 5.0 to 9.0) is critical for maximizing accuracy with Effective Reward.
- **Scalability**: Effective Reward maintains superior performance in test-time re-ranking across all N values, indicating robustness to problem complexity.
The results suggest that incorporating Effective Reward into RL frameworks enables rapid convergence, optimal policy selection, and scalable generalization to complex tasks.