# Technical Document Extraction: Control Value Over Time
## Chart Title and Parameters
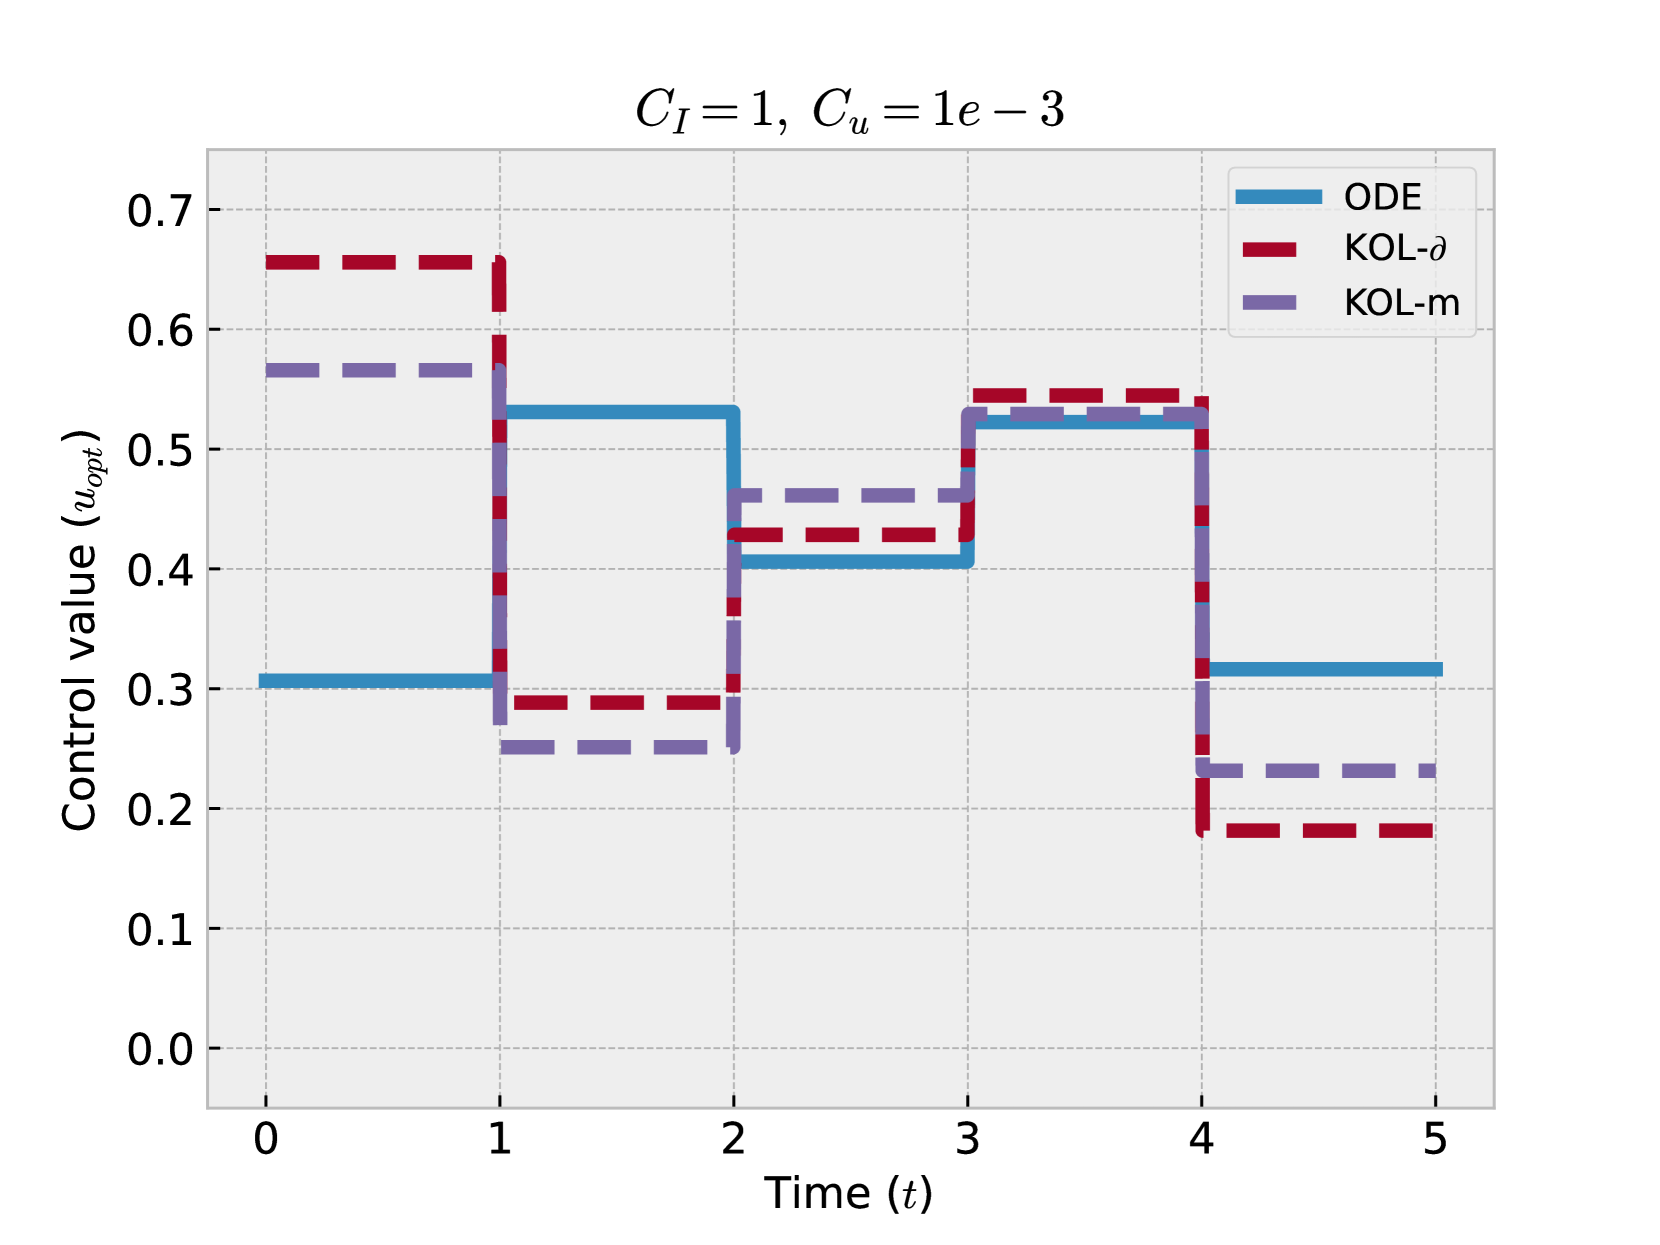
- **Title**: Control Value Over Time
- **System Parameters**:
- \( C_I = 1 \)
- \( C_u = 1 \times 10^{-3} \)
## Axes
- **X-axis (Time, \( t \))**:
- Range: \( 0 \leq t \leq 5 \)
- Markers: Integer ticks at \( t = 0, 1, 2, 3, 4, 5 \)
- **Y-axis (Control Value, \( u_{opt} \))**:
- Range: \( 0.0 \leq u_{opt} \leq 0.7 \)
- Markers: Incremental ticks at \( 0.0, 0.1, 0.2, 0.3, 0.4, 0.5, 0.6, 0.7 \)
- Grid: Dotted lines for reference
## Legend
- **Control Strategies**:
- **ODE**: Solid blue line
- **KOL-δ**: Dashed red line
- **KOL-m**: Dash-dot purple line
## Key Trends and Data Points
### ODE (Solid Blue)
- **Behavior**:
- \( t = 0 \): \( u_{opt} = 0.3 \)
- \( t = 1 \): \( u_{opt} = 0.5 \) (step increase)
- \( t = 2 \): \( u_{opt} = 0.4 \) (step decrease)
- \( t = 3 \): \( u_{opt} = 0.55 \) (step increase)
- \( t = 4 \): \( u_{opt} = 0.3 \) (step decrease)
- \( t = 5 \): \( u_{opt} = 0.3 \) (constant)
### KOL-δ (Dashed Red)
- **Behavior**:
- \( t = 0 \): \( u_{opt} = 0.6 \)
- \( t = 1 \): \( u_{opt} = 0.3 \) (step decrease)
- \( t = 2 \): \( u_{opt} = 0.4 \) (step increase)
- \( t = 3 \): \( u_{opt} = 0.4 \) (constant)
- \( t = 4 \): \( u_{opt} = 0.2 \) (step decrease)
- \( t = 5 \): \( u_{opt} = 0.2 \) (constant)
### KOL-m (Dash-Dot Purple)
- **Behavior**:
- \( t = 0 \): \( u_{opt} = 0.55 \)
- \( t = 1 \): \( u_{opt} = 0.25 \) (step decrease)
- \( t = 2 \): \( u_{opt} = 0.45 \) (step increase)
- \( t = 3 \): \( u_{opt} = 0.45 \) (constant)
- \( t = 4 \): \( u_{opt} = 0.2 \) (step decrease)
- \( t = 5 \): \( u_{opt} = 0.2 \) (constant)
## Observations
1. **ODE** exhibits the most frequent control value adjustments, with three distinct step changes.
2. **KOL-δ** shows a gradual reduction in control value over time, with a notable stabilization at \( t = 3 \).
3. **KOL-m** demonstrates the largest initial drop but stabilizes at a lower value compared to other strategies.
4. All strategies converge to \( u_{opt} = 0.2 \) by \( t = 5 \), though ODE and KOL-δ maintain higher values earlier in the timeline.
## Structural Notes
- The chart uses a Cartesian coordinate system with a white background and light gray grid lines.
- Line styles (solid, dashed, dash-dot) are used to differentiate control strategies.
- No overlapping data points are observed between strategies at any time \( t \).