# Technical Document Extraction: Decision Tree and Feature Space Partitioning
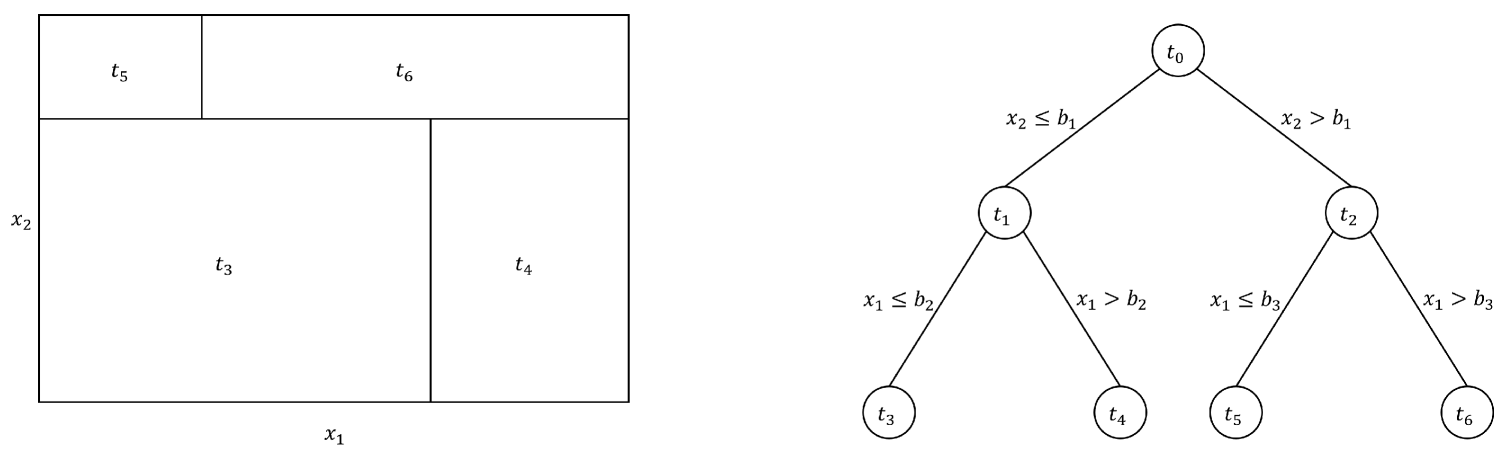
This image illustrates the relationship between a **Decision Tree** (right) and the corresponding **Recursive Partitioning of Feature Space** (left). It demonstrates how a hierarchical set of binary rules divides a 2D input space into distinct regions.
---
## 1. Component Isolation
The image is divided into two primary technical diagrams:
* **Left Region (Feature Space):** A rectangular plot representing a two-dimensional coordinate system defined by variables $x_1$ and $x_2$.
* **Right Region (Decision Tree):** A binary tree structure showing the logical flow of decisions leading to terminal nodes (leaves).
---
## 2. Right Region: Decision Tree Analysis
The diagram depicts a binary tree with three levels of nodes and specific decision criteria on the edges.
### Node Hierarchy
* **Root Node:** $t_0$
* **Internal Nodes (Level 1):** $t_1$ (left branch), $t_2$ (right branch)
* **Terminal Nodes / Leaves (Level 2):** $t_3, t_4, t_5, t_6$
### Decision Logic (Edges)
The tree splits based on thresholds $b_1, b_2,$ and $b_3$:
1. **First Split (at $t_0$):**
* Left Branch: $x_2 \leq b_1$ (leads to node $t_1$)
* Right Branch: $x_2 > b_1$ (leads to node $t_2$)
2. **Second Split (at $t_1$):**
* Left Branch: $x_1 \leq b_2$ (leads to leaf $t_3$)
* Right Branch: $x_1 > b_2$ (leads to leaf $t_4$)
3. **Third Split (at $t_2$):**
* Left Branch: $x_1 \leq b_3$ (leads to leaf $t_5$)
* Right Branch: $x_1 > b_3$ (leads to leaf $t_6$)
---
## 3. Left Region: Feature Space Partitioning
The rectangular space is defined by horizontal axis $x_1$ and vertical axis $x_2$. The space is partitioned into four distinct rectangular regions corresponding to the leaf nodes of the tree.
### Spatial Grounding and Mapping
By cross-referencing the tree logic with the visual partitions:
* **Horizontal Partition ($b_1$):** A horizontal line divides the space into a lower section ($x_2 \leq b_1$) and an upper section ($x_2 > b_1$).
* **Lower Section ($x_2 \leq b_1$):**
* Divided by a vertical line at $x_1 = b_2$.
* **Region $t_3$:** Located at the bottom-left ($x_1 \leq b_2$ AND $x_2 \leq b_1$).
* **Region $t_4$:** Located at the bottom-right ($x_1 > b_2$ AND $x_2 \leq b_1$).
* **Upper Section ($x_2 > b_1$):**
* Divided by a vertical line at $x_1 = b_3$.
* **Region $t_5$:** Located at the top-left ($x_1 \leq b_3$ AND $x_2 > b_1$).
* **Region $t_6$:** Located at the top-right ($x_1 > b_3$ AND $x_2 > b_1$).
---
## 4. Summary of Extracted Data Labels
| Label | Type | Description |
| :--- | :--- | :--- |
| $x_1$ | Axis/Variable | Horizontal feature dimension. |
| $x_2$ | Axis/Variable | Vertical feature dimension. |
| $t_0$ | Node | Root of the decision tree. |
| $t_1, t_2$ | Node | Intermediate decision points. |
| $t_3, t_4, t_5, t_6$ | Leaf/Region | Final classification or regression outcomes/regions. |
| $b_1, b_2, b_3$ | Constant | Threshold values for splitting the data. |
| $\leq, >$ | Operator | Comparison operators defining the decision boundaries. |