## Line Chart: HotPotQA Episodic Memory Performance
### Overview
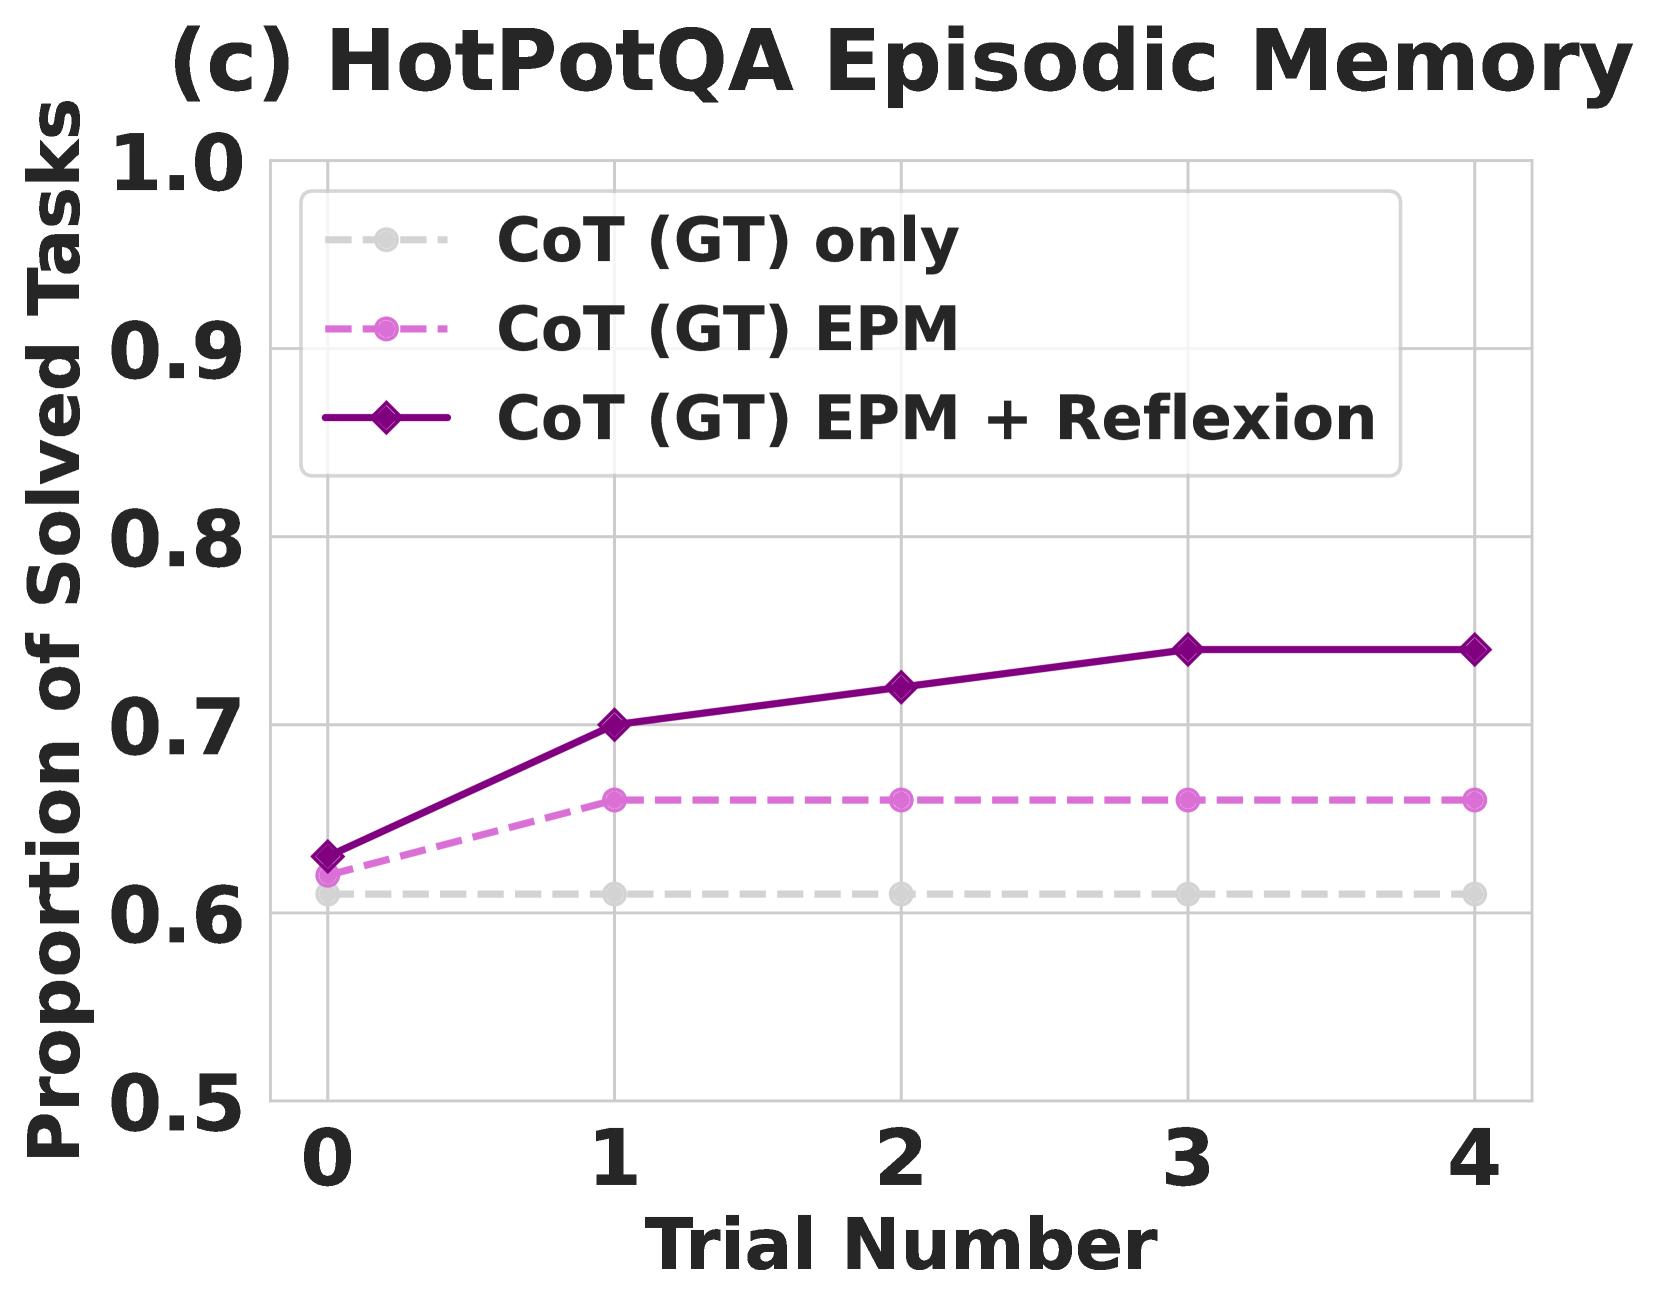
This is a line chart titled "(c) HotPotQA Episodic Memory." It plots the performance of three different methods on a task over a series of trials. The performance metric is the proportion of tasks solved, and the chart shows how this proportion changes from trial 0 to trial 4.
### Components/Axes
* **Title:** "(c) HotPotQA Episodic Memory"
* **Y-axis:** Label is "Proportion of Solved Tasks". Scale ranges from 0.5 to 1.0, with major gridlines at 0.1 intervals (0.5, 0.6, 0.7, 0.8, 0.9, 1.0).
* **X-axis:** Label is "Trial Number". Discrete markers at integers 0, 1, 2, 3, and 4.
* **Legend:** Positioned in the top-left quadrant of the chart area. Contains three entries:
1. `CoT (GT) only`: Represented by a gray, dashed line with circular markers.
2. `CoT (GT) EPM`: Represented by a pink, dashed line with circular markers.
3. `CoT (GT) EPM + Reflexion`: Represented by a purple, solid line with diamond markers.
### Detailed Analysis
**Trend Verification & Data Points (Approximate Values):**
1. **CoT (GT) only (Gray, dashed line):**
* **Trend:** The line is essentially flat, showing no improvement across trials.
* **Data Points:** The proportion of solved tasks remains constant at approximately **0.61** for all trials (0 through 4).
2. **CoT (GT) EPM (Pink, dashed line):**
* **Trend:** The line shows an initial increase from trial 0 to trial 1 and then plateaus.
* **Data Points:**
* Trial 0: ~0.62
* Trial 1: ~0.66
* Trials 2, 3, 4: ~0.66 (plateau)
3. **CoT (GT) EPM + Reflexion (Purple, solid line):**
* **Trend:** The line shows a steady upward trend from trial 0 to trial 3, after which it plateaus. It consistently outperforms the other two methods.
* **Data Points:**
* Trial 0: ~0.63
* Trial 1: ~0.70
* Trial 2: ~0.72
* Trial 3: ~0.74
* Trial 4: ~0.74 (plateau)
### Key Observations
* **Performance Hierarchy:** The method `CoT (GT) EPM + Reflexion` achieves the highest proportion of solved tasks at every trial point after trial 0. `CoT (GT) EPM` performs better than the baseline `CoT (GT) only` but worse than the version with Reflexion.
* **Learning Curves:** The baseline (`CoT (GT) only`) shows no learning. The `CoT (GT) EPM` method shows a one-time improvement after the first trial. The `CoT (GT) EPM + Reflexion` method shows continuous improvement over the first three trials.
* **Convergence:** Both methods that include EPM (with or without Reflexion) appear to reach a performance plateau by trial 3 or 4.
### Interpretation
The chart demonstrates the incremental value of adding episodic memory (EPM) and a reflection mechanism (Reflexion) to a Chain-of-Thought (CoT) reasoning system on the HotPotQA benchmark.
* **Baseline Limitation:** The flat line for `CoT (GT) only` suggests that simply using Chain-of-Thought with ground truth (GT) information does not allow the system to learn or improve from repeated trials on similar tasks.
* **Value of Episodic Memory:** The improvement shown by `CoT (GT) EPM` indicates that incorporating episodic memory enables the system to retain and leverage information from previous trials, leading to a performance boost after the first experience.
* **Synergy with Reflexion:** The superior and continuously improving performance of `CoT (GT) EPM + Reflexion` suggests that combining episodic memory with a reflective process creates a powerful synergy. The system not only remembers past episodes but also actively reasons about them, leading to more effective learning and problem-solving over multiple attempts. The plateau after trial 3 may indicate that the system has reached the limit of its learning capacity for this specific task setup or that the remaining unsolved tasks are of a different, more difficult nature.