## Scatter Plot: NSGA-II with N=n+1 on LOTZ
### Overview
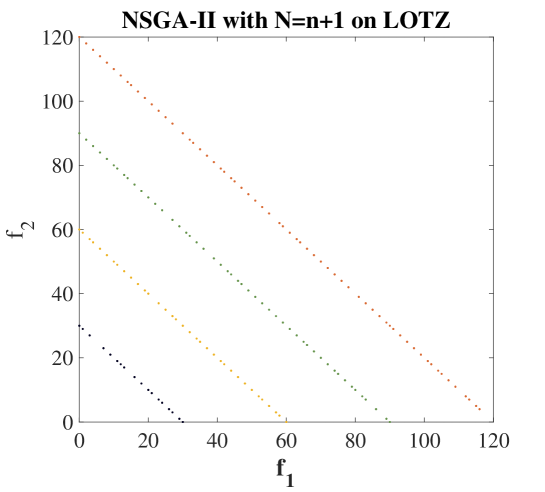
The image is a scatter plot titled "NSGA-II with N=n+1 on LOTZ". It displays four distinct data series, each represented by a different color (black, yellow, green, and brown). Each series forms a roughly linear, downward-sloping trend. The x-axis is labeled "f1" and the y-axis is labeled "f2". The plot ranges from 0 to 120 on both axes.
### Components/Axes
* **Title:** NSGA-II with N=n+1 on LOTZ
* **X-axis:**
* Label: f1
* Scale: 0 to 120, with tick marks at approximately every 20 units.
* **Y-axis:**
* Label: f2
* Scale: 0 to 120, with tick marks at approximately every 20 units.
* **Data Series:** Four distinct series, each with a different color. No explicit legend is provided, but the colors are:
* Black
* Yellow
* Green
* Brown
### Detailed Analysis
* **Black Series:** This series is located closest to the origin. It starts at approximately (0, 30) and slopes downward to approximately (25, 0).
* **Yellow Series:** This series is shifted to the right compared to the black series. It starts at approximately (25, 60) and slopes downward to approximately (50, 0).
* **Green Series:** This series is shifted further to the right. It starts at approximately (50, 90) and slopes downward to approximately (75, 0).
* **Brown Series:** This series is the furthest to the right. It starts at approximately (75, 120) and slopes downward to approximately (120, 0).
### Key Observations
* All four data series exhibit a negative correlation between f1 and f2.
* The series are roughly parallel to each other, indicating a similar relationship between f1 and f2 across all series.
* The series are evenly spaced horizontally.
### Interpretation
The scatter plot likely represents the Pareto front solutions obtained by the NSGA-II algorithm on the LOTZ problem. Each series could represent a different run or a different set of parameters for the algorithm. The downward-sloping trend indicates a trade-off between the two objectives, f1 and f2. As one objective is minimized, the other tends to increase. The even spacing of the series might suggest a consistent performance of the algorithm across different runs or parameter settings. The plot visualizes the set of non-dominated solutions, where no solution is better than any other in terms of both objectives.