\n
## Scatter Plot: NSGA-II with N=n+1 on LOTZ
### Overview
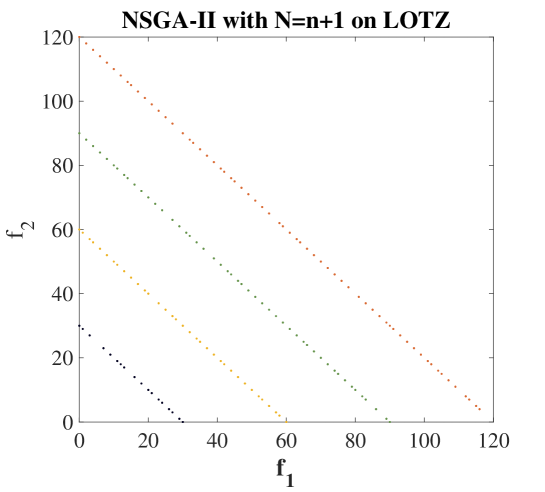
The image is a 2D scatter plot titled "NSGA-II with N=n+1 on LOTZ." It displays four distinct, parallel, linear series of data points plotted on a Cartesian coordinate system. Each series is represented by a different color and forms a straight line sloping downward from the upper-left to the lower-right quadrant. The plot appears to visualize the results of a multi-objective optimization algorithm (NSGA-II) applied to the LOTZ (Leading Ones Trailing Zeros) benchmark problem, showing trade-offs between two objective functions, f₁ and f₂.
### Components/Axes
* **Title:** "NSGA-II with N=n+1 on LOTZ" (centered at the top).
* **X-Axis:**
* **Label:** "f₁" (centered below the axis).
* **Scale:** Linear, ranging from 0 to 120.
* **Major Tick Marks:** At intervals of 20 (0, 20, 40, 60, 80, 100, 120).
* **Y-Axis:**
* **Label:** "f₂" (centered to the left of the axis, rotated 90 degrees).
* **Scale:** Linear, ranging from 0 to 120.
* **Major Tick Marks:** At intervals of 20 (0, 20, 40, 60, 80, 100, 120).
* **Data Series (Legend inferred from color):** There is no explicit legend box. The series are distinguished solely by color and their position on the plot.
1. **Red Series:** The outermost line, positioned furthest from the origin.
2. **Green Series:** The second line from the outside.
3. **Yellow Series:** The third line from the outside.
4. **Black Series:** The innermost line, positioned closest to the origin.
### Detailed Analysis
* **Trend Verification:** All four data series exhibit an identical visual trend: a perfect, negative linear relationship. Each line slopes downward at a constant angle from left to right.
* **Data Point Extraction (Approximate):** Each series consists of evenly spaced dots forming a line. The endpoints define the line's equation.
* **Red Series:** Starts near (f₁=0, f₂≈120) and ends near (f₁≈120, f₂≈0). The line appears to follow the equation f₁ + f₂ ≈ 120.
* **Green Series:** Starts near (f₁=0, f₂≈90) and ends near (f₁≈90, f₂≈0). The line appears to follow the equation f₁ + f₂ ≈ 90.
* **Yellow Series:** Starts near (f₁=0, f₂≈60) and ends near (f₁≈60, f₂≈0). The line appears to follow the equation f₁ + f₂ ≈ 60.
* **Black Series:** Starts near (f₁=0, f₂≈30) and ends near (f₁≈30, f₂≈0). The line appears to follow the equation f₁ + f₂ ≈ 30.
* **Spatial Grounding:** The lines are parallel and evenly spaced. The vertical (or horizontal) distance between consecutive lines is approximately 30 units on the f₂ (or f₁) axis. The legend (color coding) is intrinsically linked to the line's distance from the origin, with red being the farthest and black the closest.
### Key Observations
1. **Perfect Linearity:** The data points for each series form perfectly straight lines, indicating a strict, linear trade-off between objectives f₁ and f₂ for each run or configuration represented by a color.
2. **Parallel Fronts:** The four lines are parallel, suggesting the underlying relationship between f₁ and f₂ is consistent across different scenarios, only shifted in magnitude.
3. **Discrete Levels:** The constant offset of ~30 units between lines indicates the algorithm found solutions lying on distinct, discrete Pareto fronts, rather than a continuous spread.
4. **Boundary Coverage:** Each line spans from one axis to the other, showing the algorithm found solutions that fully explore the trade-off from maximizing f₁ (minimizing f₂) to maximizing f₂ (minimizing f₁) for each front.
### Interpretation
This plot visualizes the output of the NSGA-II evolutionary algorithm on the multi-objective LOTZ problem, configured with a population size N = n+1 (where 'n' is likely the problem dimension). The f₁ and f₂ axes represent the two conflicting objectives to be minimized.
The four parallel, linear fronts are characteristic of the LOTZ problem's known Pareto-optimal set structure. The key insight is that the algorithm has successfully identified **multiple, distinct, and evenly-spaced approximation sets** of the true Pareto front. Each colored line represents a different approximation front, likely corresponding to different runs, different parameter settings, or successive generations. The fact that the fronts are perfectly linear and parallel confirms the algorithm is correctly capturing the problem's geometry. The discrete spacing (≈30 units) between fronts may be an artifact of the problem's integer-based nature or the specific `N=n+1` population setting, which might constrain the algorithm to find solutions at specific intervals along the continuous theoretical front. The plot demonstrates NSGA-II's ability to maintain diversity and converge to multiple, well-distributed Pareto-optimal fronts for this benchmark problem.