## Line Chart: Accuracy and Computation vs. Step Padding
### Overview
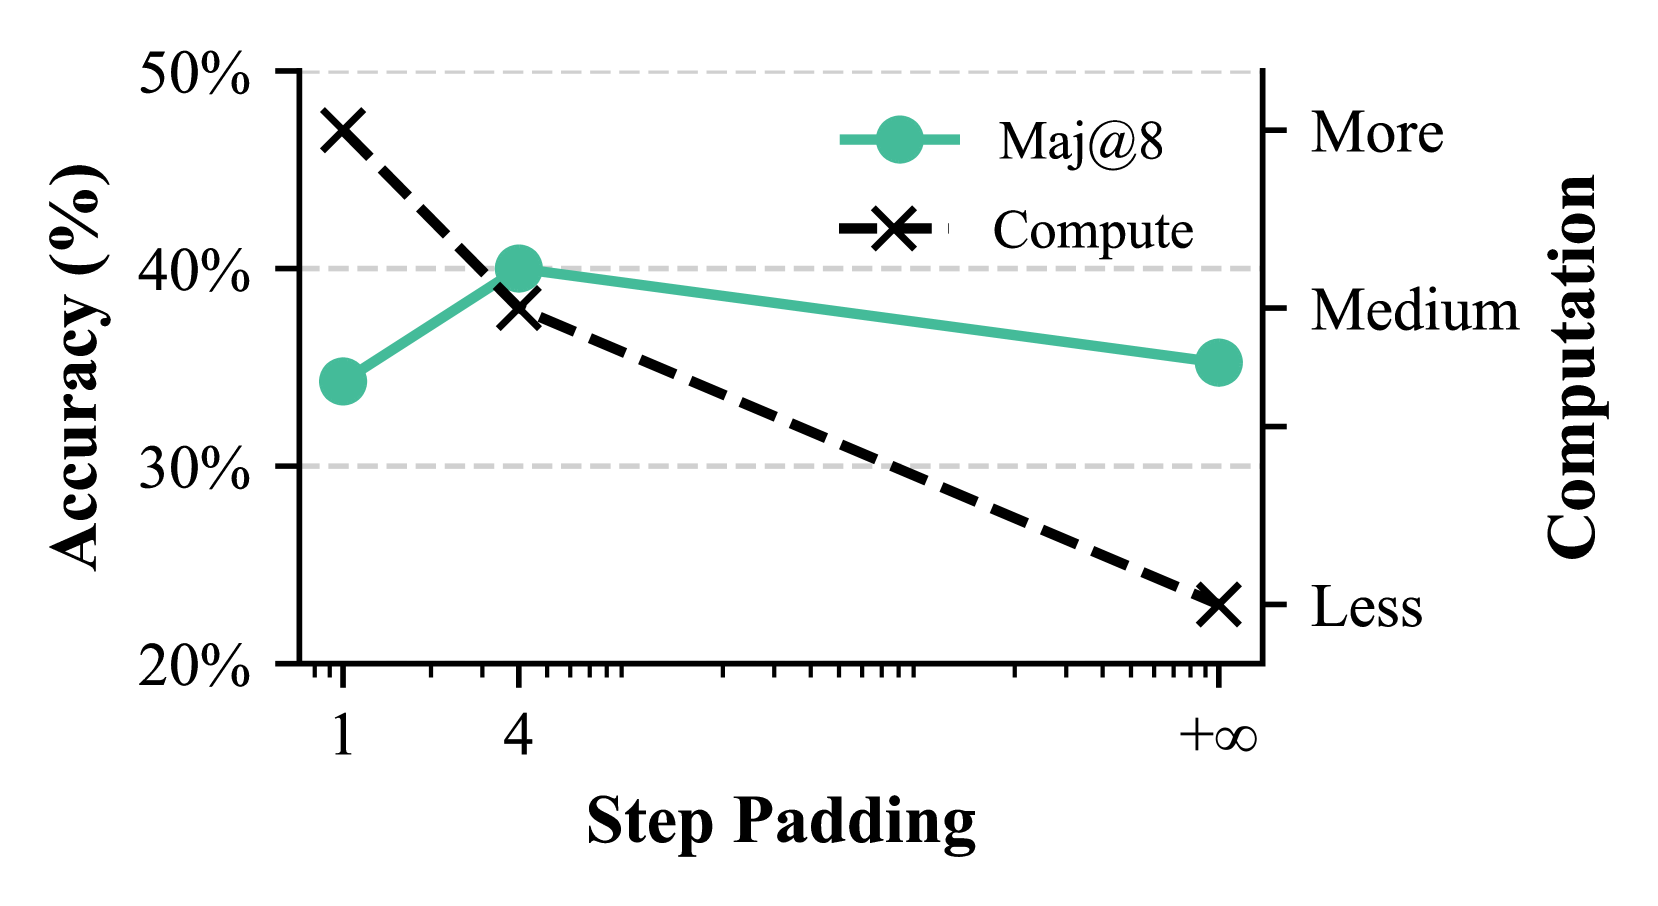
The image is a line chart comparing the accuracy (left y-axis) and computation (right y-axis) against step padding (x-axis). Two data series are plotted: "Maj@8" (teal line with circular markers) and "Compute" (black dashed line with 'x' markers). The x-axis represents step padding with values 1, 4, and +∞. The right y-axis indicates computation levels as "More", "Medium", and "Less".
### Components/Axes
* **X-axis:** "Step Padding" with values 1, 4, and +∞.
* **Left Y-axis:** "Accuracy (%)" with values 20%, 30%, 40%, and 50%.
* **Right Y-axis:** "Computation" with levels "Less", "Medium", and "More".
* **Legend:** Located in the top-right of the chart.
* Teal line with circular markers: "Maj@8"
* Black dashed line with 'x' markers: "Compute"
### Detailed Analysis
* **Maj@8 (Teal Line):**
* At Step Padding = 1, Accuracy is approximately 34%.
* At Step Padding