## Line Chart: Accuracy vs. Step Padding with Computation Levels
### Overview
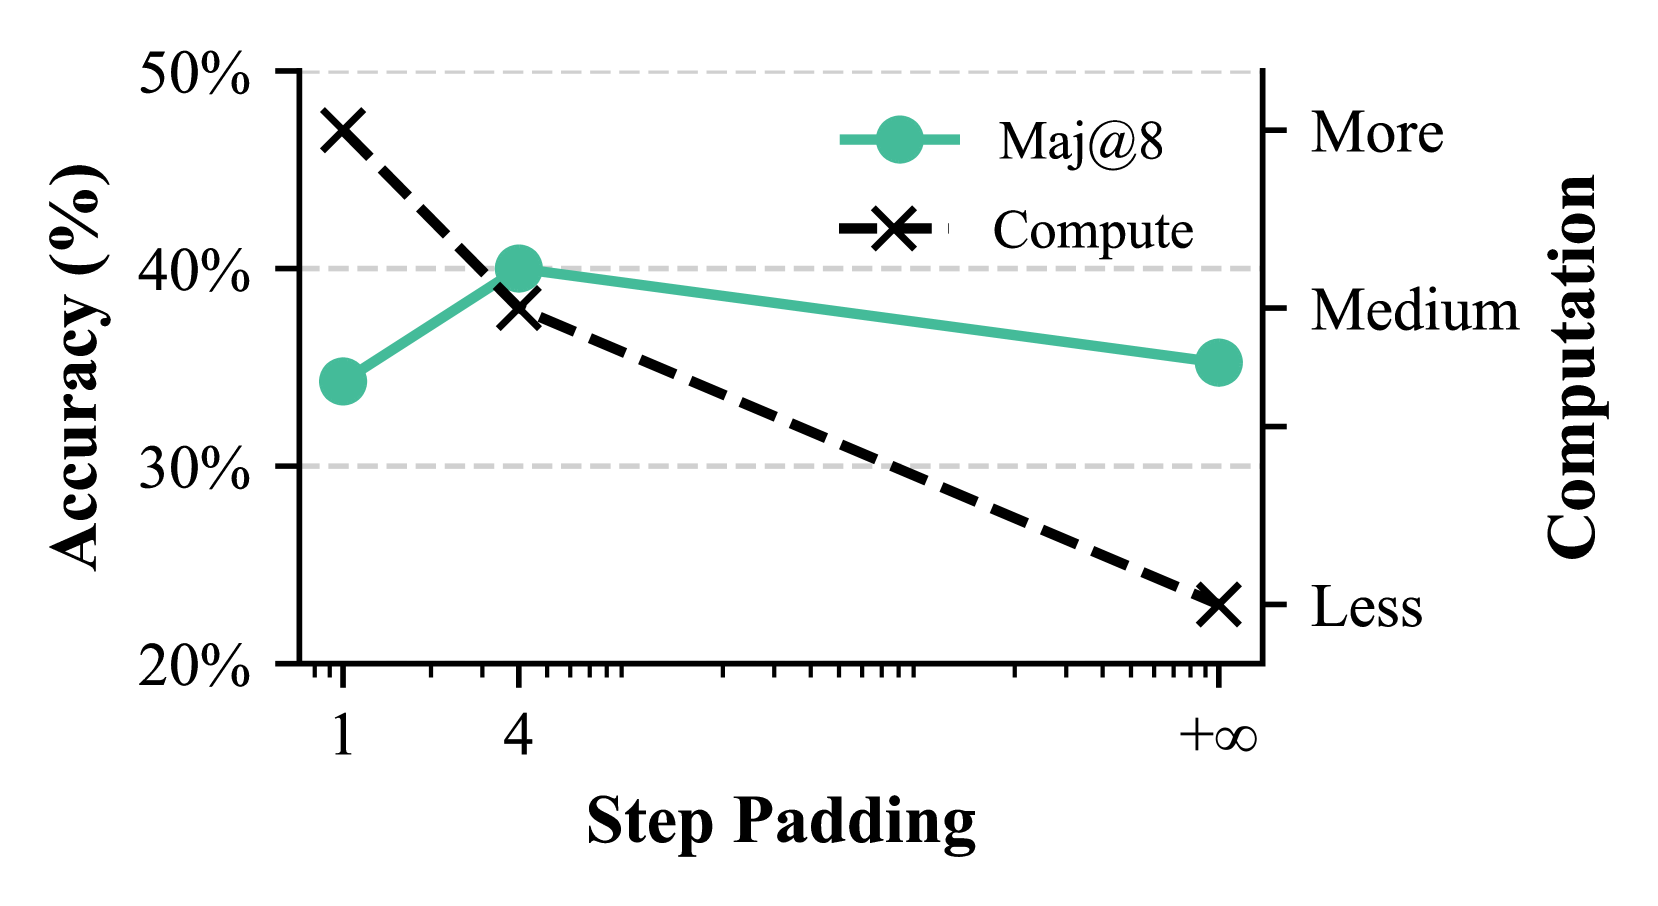
This image displays a line chart illustrating the relationship between "Step Padding" on the x-axis and "Accuracy (%)" on the y-axis. Two data series are plotted: "Maj@8" (represented by a teal line with circular markers) and "Compute" (represented by a dashed black line with cross markers). A secondary y-axis on the right indicates levels of "Computation" (More, Medium, Less).
### Components/Axes
* **Primary Y-axis (Left):**
* **Title:** "Accuracy (%)"
* **Scale:** Ranges from 20% to 50%, with major tick marks at 20%, 30%, 40%, and 50%.
* **Tick Markers:** Labeled at 20%, 30%, 40%, 50%.
* **X-axis:**
* **Title:** "Step Padding"
* **Scale:** Logarithmic scale, with labeled tick marks at 1, 4, and "+∞". There are also minor tick marks between these labels.
* **Secondary Y-axis (Right):**
* **Title:** "Computation" (rotated vertically)
* **Scale:** Categorical, with labels "More", "Medium", and "Less" positioned at different vertical levels.
* "More" is aligned with the top of the chart area.
* "Medium" is aligned approximately with the 40% mark on the primary y-axis.
* "Less" is aligned approximately with the 20% mark on the primary y-axis.
* **Legend:**
* Located in the top-center area of the chart.
* **"Maj@8":** Teal line with a circular marker.
* **"Compute":** Dashed black line with a cross marker.
### Detailed Analysis
**Data Series: Maj@8 (Teal line with circular markers)**
* **Trend:** The "Maj@8" line generally slopes downward as "Step Padding" increases.
* **Data Points:**
* At Step Padding = 1: Accuracy is approximately 35% (±1%).
* At Step Padding = 4: Accuracy is approximately 40% (±1%).
* At Step Padding = +∞: Accuracy is approximately 35% (±1%).
**Data Series: Compute (Dashed black line with cross markers)**
* **Trend:** The "Compute" line slopes downward sharply as "Step Padding" increases.
* **Data Points:**
* At Step Padding = 1: Accuracy is approximately 46% (±1%).
* At Step Padding = 4: Accuracy is approximately 39% (±1%).
* At Step Padding = +∞: Accuracy is approximately 23% (±1%).
### Key Observations
* Both data series show a decrease in accuracy as "Step Padding" increases, although the "Compute" series exhibits a more pronounced decline.
* The "Maj@8" series shows an initial increase in accuracy from Step Padding 1 to 4, followed by a decrease.
* The "Compute" series starts with the highest accuracy at Step Padding 1 but drops significantly by Step Padding +∞.
* At Step Padding 4, the accuracy for both "Maj@8" and "Compute" is very close, around 40% and 39% respectively.
* The "Computation" axis suggests that higher "Step Padding" values correspond to "Less" computation.
### Interpretation
The chart demonstrates the trade-off between "Step Padding" and "Accuracy" for two different methods, "Maj@8" and "Compute". The x-axis, "Step Padding", is presented on a logarithmic scale, with "+∞" representing the highest level of padding (and thus, presumably, the least computation).
The data suggests that increasing "Step Padding" generally leads to a decrease in accuracy, particularly for the "Compute" method, which experiences a substantial drop. The "Maj@8" method shows a more nuanced behavior, with an initial improvement in accuracy at a moderate level of padding (Step Padding = 4) before declining.
The secondary axis, "Computation", implies that as "Step Padding" increases towards infinity, the computational cost decreases. Therefore, the chart illustrates that while reducing computation (by increasing padding) can be beneficial for efficiency, it comes at the cost of accuracy, with the "Compute" method being more sensitive to this trade-off than "Maj@8". The point at Step Padding = 4 appears to be a sweet spot where both methods achieve relatively high accuracy with potentially moderate computational requirements. The "Maj@8" method seems to be more robust to higher levels of padding compared to the "Compute" method.