## Chart: CDF of Recomputed Tokens per Request
### Overview
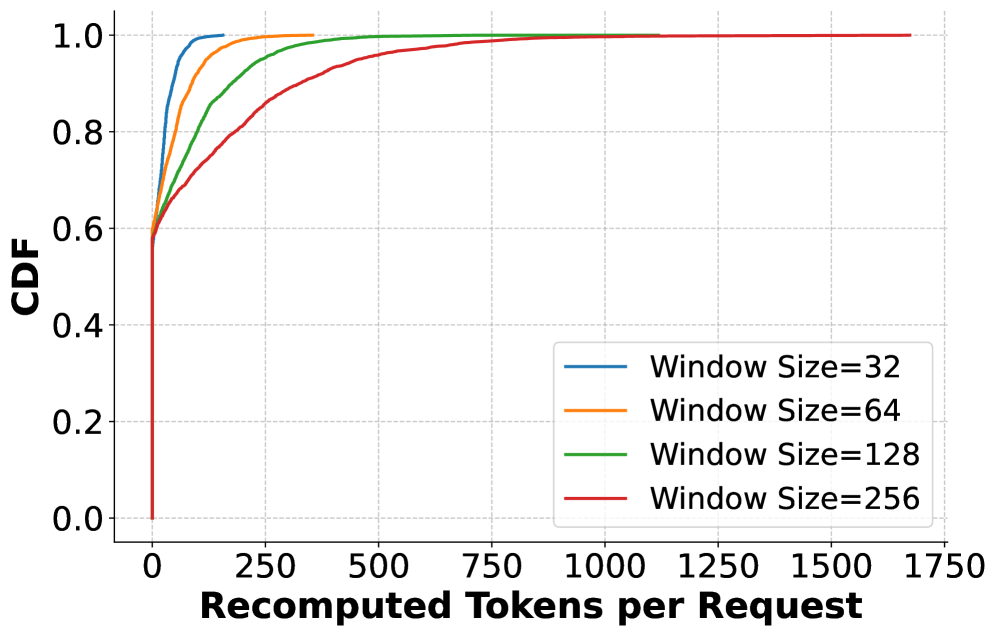
The image is a Cumulative Distribution Function (CDF) plot showing the distribution of recomputed tokens per request for different window sizes (32, 64, 128, and 256). The x-axis represents the number of recomputed tokens per request, and the y-axis represents the cumulative probability (CDF).
### Components/Axes
* **X-axis:** "Recomputed Tokens per Request". The scale ranges from 0 to 1750, with tick marks at intervals of 250 (0, 250, 500, 750, 1000, 1250, 1500, 1750).
* **Y-axis:** "CDF" (Cumulative Distribution Function). The scale ranges from 0.0 to 1.0, with tick marks at intervals of 0.2 (0.0, 0.2, 0.4, 0.6, 0.8, 1.0).
* **Legend:** Located in the bottom-right corner of the plot. It identifies the different lines by their corresponding window sizes:
* Blue: Window Size = 32
* Orange: Window Size = 64
* Green: Window Size = 128
* Red: Window Size = 256
### Detailed Analysis
* **Window Size = 32 (Blue):** The CDF rises sharply near x=0, reaching a CDF of approximately 0.95 by x=100. It then gradually approaches 1.0.
* **Window Size = 64 (Orange):** The CDF rises sharply near x=0, reaching a CDF of approximately 0.9 by x=150. It then gradually approaches 1.0.
* **Window Size = 128 (Green):** The CDF rises sharply near x=0, reaching a CDF of approximately 0.7 by x=200. It then gradually approaches 1.0.
* **Window Size = 256 (Red):** The CDF rises sharply near x=0, reaching a CDF of approximately 0.6 by x=25. It then gradually approaches 1.0, but at a slower rate compared to the other window sizes. It reaches a CDF of approximately 0.8 by x=500, and 0.9 by x=750.
### Key Observations
* Smaller window sizes (32 and 64) have a steeper initial rise in their CDF curves, indicating that a larger proportion of requests require fewer recomputed tokens.
* Larger window sizes (128 and 256) have a more gradual rise, indicating that a larger proportion of requests require more recomputed tokens.
* All CDF curves eventually approach 1.0, meaning that all requests will eventually be processed, regardless of the number of recomputed tokens required.
### Interpretation
The CDF plot illustrates the impact of window size on the distribution of recomputed tokens per request. Smaller window sizes result in a higher proportion of requests requiring fewer recomputed tokens, suggesting better efficiency in terms of token usage. Conversely, larger window sizes lead to a broader distribution, with a greater proportion of requests requiring more recomputed tokens. This suggests a trade-off between window size and token recomputation efficiency. The choice of window size should be based on the specific requirements of the system, considering factors such as token availability and request processing latency.