## Line Chart: Cumulative Distribution Function (CDF) of Recomputed Tokens per Request
### Overview
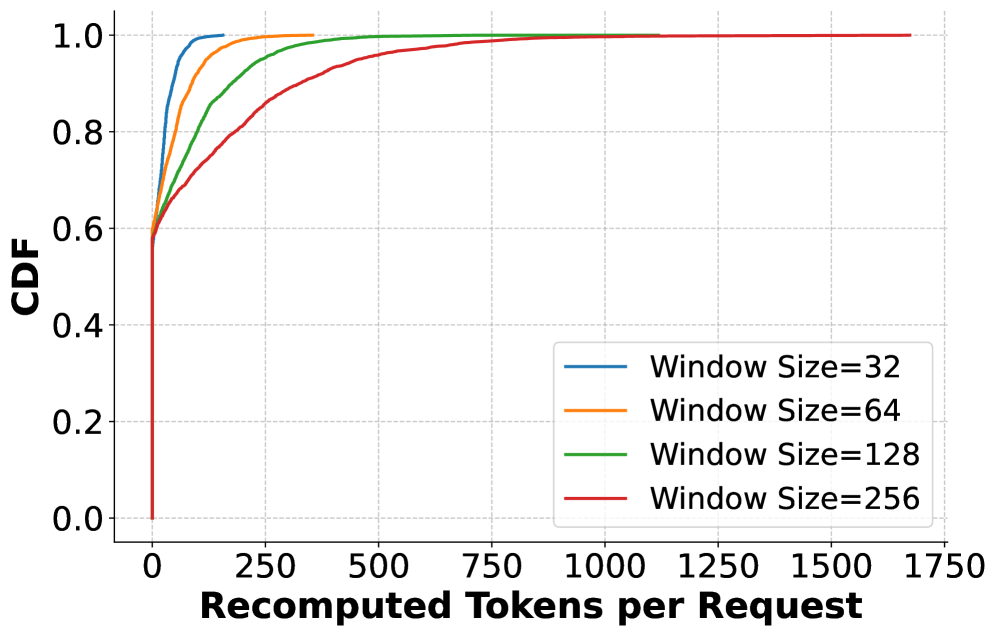
This image displays a Cumulative Distribution Function (CDF) plot illustrating the distribution of "Recomputed Tokens per Request" across four different "Window Size" configurations (32, 64, 128, and 256). The chart demonstrates how increasing the window size impacts the number of tokens that need to be recomputed during a request process.
### Components/Axes
* **Y-Axis (Vertical):** Labeled "CDF". The scale ranges from 0.0 to 1.0, representing the cumulative probability (0% to 100% of requests).
* **X-Axis (Horizontal):** Labeled "Recomputed Tokens per Request". The scale ranges from 0 to 1750, with major tick marks every 250 units.
* **Legend:** Located in the bottom-right quadrant of the chart area.
* **Blue Line:** Window Size=32
* **Orange Line:** Window Size=64
* **Green Line:** Window Size=128
* **Red Line:** Window Size=256
* **Grid:** A light gray dashed grid is overlaid to assist in reading values.
### Detailed Analysis
The chart shows four distinct curves, all originating from the same point on the Y-axis.
* **Common Baseline:** All four lines start at the coordinate (0, ~0.6). This indicates that approximately 60% of all requests, regardless of the window size configuration, require 0 recomputed tokens.
* **Trend Verification:** After the initial jump at x=0, all lines slope upward toward a CDF of 1.0. The slope of the lines is inversely proportional to the window size; smaller window sizes reach the 1.0 CDF threshold much faster (at lower X values) than larger window sizes.
**Data Point Estimates (approximate X-values for specific CDF thresholds):**
| Window Size | CDF = 0.8 (80th percentile) | CDF = 1.0 (Max/Tail) |
| :--- | :--- | :--- |
| **32 (Blue)** | ~50 tokens | ~150 tokens |
| **64 (Orange)** | ~100 tokens | ~350 tokens |
| **128 (Green)** | ~200 tokens | ~600 tokens |
| **256 (Red)** | ~400 tokens | ~1600 tokens |
### Key Observations
* **The "Zero-Cost" Majority:** The most significant feature is the vertical jump from 0 to 0.6 at the origin. This suggests that for the majority of requests (60%), the system is highly efficient, requiring no recomputation.
* **Window Size Impact:** There is a clear, positive correlation between the "Window Size" and the number of "Recomputed Tokens." As the window size doubles (32 -> 64 -> 128 -> 256), the tail of the distribution (the X-value where CDF reaches 1.0) extends significantly to the right.
* **Distribution Spread:** The "Red" line (Window Size=256) has the widest distribution, indicating that while it shares the same 60% "zero-cost" baseline, the remaining 40% of requests experience a much wider variance in recomputation costs, extending up to ~1600 tokens.
### Interpretation
This data likely represents the performance characteristics of a Large Language Model (LLM) inference system, specifically regarding KV (Key-Value) cache management or speculative decoding strategies.
* **Efficiency Trade-off:** The chart demonstrates a clear trade-off. Smaller window sizes (e.g., 32) are significantly more efficient, as they cap the maximum recomputation cost at a very low level (~150 tokens). Larger window sizes (e.g., 256) allow for larger context windows but introduce a "long tail" of potential recomputation costs, reaching up to 1600 tokens.
* **System Behavior:** The fact that 60% of requests require zero recomputation suggests that for most interactions, the system is either hitting a cache perfectly or the context length is small enough that the window size constraint is not triggered.
* **Operational Implications:** If a system architect needs to minimize latency spikes (outliers), they would prefer a smaller window size. If the application requires handling longer context windows, they must accept the risk of significantly higher recomputation costs for the 40% of requests that fall outside the "zero-cost" baseline.