\n
## Chart: Cumulative Distribution Function of Recomputed Tokens per Request
### Overview
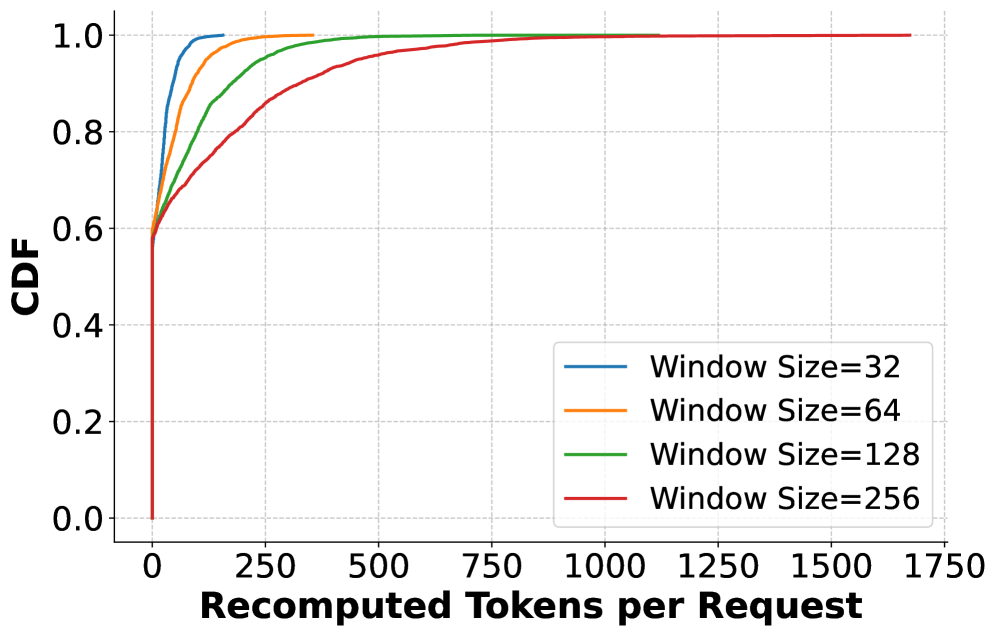
The image presents a cumulative distribution function (CDF) plot illustrating the relationship between the number of recomputed tokens per request and the cumulative probability. The plot compares this relationship for different window sizes: 32, 64, 128, and 256.
### Components/Axes
* **X-axis Title:** "Recomputed Tokens per Request"
* Scale: 0 to 1750, with markers at 0, 250, 500, 750, 1000, 1250, and 1750.
* **Y-axis Title:** "CDF" (Cumulative Distribution Function)
* Scale: 0.0 to 1.0, with markers at 0.0, 0.2, 0.4, 0.6, 0.8, and 1.0.
* **Legend:** Located in the top-right corner.
* Window Size=32 (Blue)
* Window Size=64 (Orange)
* Window Size=128 (Green)
* Window Size=256 (Red)
### Detailed Analysis
The chart displays four CDF curves, each representing a different window size.
* **Window Size = 32 (Blue):** The curve starts at approximately (0, 0) and rapidly increases, reaching a CDF of approximately 0.8 at around 150 recomputed tokens. It plateaus around a CDF of 0.95 at approximately 300 recomputed tokens, and approaches 1.0 around 600 recomputed tokens.
* **Window Size = 64 (Orange):** This curve begins similarly to the blue curve, but its initial rise is slightly slower. It reaches a CDF of approximately 0.8 at around 200 recomputed tokens. It plateaus around a CDF of 0.95 at approximately 400 recomputed tokens, and approaches 1.0 around 700 recomputed tokens.
* **Window Size = 128 (Green):** The green curve exhibits a slower initial rise compared to the blue and orange curves. It reaches a CDF of approximately 0.8 at around 250 recomputed tokens. It plateaus around a CDF of 0.95 at approximately 500 recomputed tokens, and approaches 1.0 around 900 recomputed tokens.
* **Window Size = 256 (Red):** This curve has the slowest initial rise of all four. It reaches a CDF of approximately 0.8 at around 300 recomputed tokens. It plateaus around a CDF of 0.95 at approximately 600 recomputed tokens, and approaches 1.0 around 1200 recomputed tokens.
All curves eventually converge towards a CDF of 1.0 as the number of recomputed tokens increases.
### Key Observations
* Larger window sizes generally require more recomputed tokens to achieve the same CDF value.
* The CDF curves demonstrate that a significant portion of requests require a relatively small number of recomputed tokens, while a smaller portion of requests require a larger number.
* The difference in CDF values between the window sizes is most pronounced at lower recomputed token counts.
### Interpretation
The data suggests that increasing the window size leads to a higher number of recomputed tokens per request. This is likely due to the increased context considered by larger windows, which may necessitate more frequent recomputation to maintain accuracy or consistency. The CDF plot provides a probabilistic view of this relationship, showing the distribution of recomputed token counts for each window size.
The curves' convergence towards CDF=1 indicates that, regardless of window size, there's an upper limit to the number of recomputed tokens required for any given request. The differences in the curves highlight a trade-off between window size and computational cost. Smaller window sizes may be more efficient in terms of recomputed tokens, but they may sacrifice accuracy or context awareness. Larger window sizes may provide better accuracy but at the expense of increased computational cost.
The plot is useful for understanding the performance characteristics of a system that utilizes different window sizes and for making informed decisions about the optimal window size based on specific performance requirements.