\n
## CDF Chart: Recomputed Tokens per Request by Window Size
### Overview
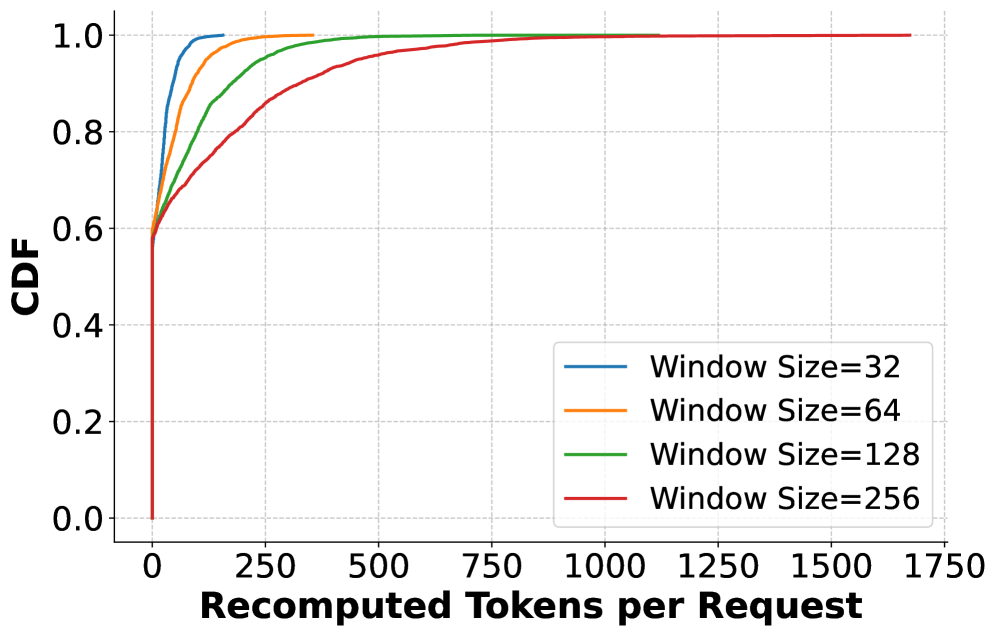
The image displays a Cumulative Distribution Function (CDF) plot comparing the distribution of "Recomputed Tokens per Request" across four different window size configurations. The chart illustrates how the probability of a request requiring a certain number of recomputed tokens changes as the window size increases.
### Components/Axes
* **Chart Type:** Cumulative Distribution Function (CDF) line plot.
* **X-Axis:**
* **Label:** "Recomputed Tokens per Request"
* **Scale:** Linear, ranging from 0 to 1750.
* **Major Ticks:** 0, 250, 500, 750, 1000, 1250, 1500, 1750.
* **Y-Axis:**
* **Label:** "CDF"
* **Scale:** Linear, ranging from 0.0 to 1.0.
* **Major Ticks:** 0.0, 0.2, 0.4, 0.6, 0.8, 1.0.
* **Legend:**
* **Position:** Bottom-right quadrant of the plot area.
* **Content:** Four entries, each associating a colored line with a "Window Size" value.
* **Entries (from top to bottom in legend):**
1. Blue line: "Window Size=32"
2. Orange line: "Window Size=64"
3. Green line: "Window Size=128"
4. Red line: "Window Size=256"
* **Grid:** Dashed grid lines are present for both major X and Y ticks.
* **Background:** White plot area with a light gray border.
### Detailed Analysis
The chart plots four CDF curves, each representing a different window size. All curves originate at (0, 0.0) and asymptotically approach a CDF of 1.0 as the number of recomputed tokens increases.
**Trend Verification & Data Point Extraction (Approximate):**
1. **Blue Line (Window Size=32):**
* **Trend:** Steepest initial ascent, reaching near 1.0 the fastest.
* **Key Points:** CDF ≈ 0.6 at X=0 (vertical jump). Reaches CDF ≈ 0.9 by X≈100. Approaches CDF ≈ 1.0 by X≈250.
2. **Orange Line (Window Size=64):**
* **Trend:** Less steep than blue, but steeper than green and red.
* **Key Points:** CDF ≈ 0.6 at X=0. Reaches CDF ≈ 0.9 by X≈200. Approaches CDF ≈ 1.0 by X≈500.
3. **Green Line (Window Size=128):**
* **Trend:** More gradual ascent than orange.
* **Key Points:** CDF ≈ 0.6 at X=0. Reaches CDF ≈ 0.9 by X≈400. Approaches CDF ≈ 1.0 by X≈750.
4. **Red Line (Window Size=256):**
* **Trend:** Most gradual ascent, with the longest tail.
* **Key Points:** CDF ≈ 0.6 at X=0. Reaches CDF ≈ 0.8 by X≈250. Reaches CDF ≈ 0.9 by X≈500. Approaches CDF ≈ 1.0 by X≈1000, with a very gradual approach to 1.0 extending beyond X=1500.
**Spatial Grounding:** The legend is placed in the bottom-right, overlapping the tail of the red and green curves. The lines are clearly distinguishable by color as defined in the legend.
### Key Observations
1. **Clear Ordering:** There is a strict, non-crossing order to the curves. For any given number of recomputed tokens (X-value), the CDF is highest for Window Size=32 and lowest for Window Size=256. This means a smaller window size has a higher probability of requiring fewer recomputed tokens.
2. **Initial Jump:** All four curves exhibit a near-vertical jump from CDF=0.0 to CDF≈0.6 at X=0. This indicates that approximately 60% of requests, regardless of window size, require zero or a negligible number of recomputed tokens.
3. **Tail Behavior:** The "tail" of the distribution (the approach to CDF=1.0) becomes significantly longer as window size increases. The red line (256) has a very long, shallow tail compared to the blue line (32).
4. **Median Points (CDF=0.5):** The median number of recomputed tokens (where CDF=0.5) is effectively 0 for all configurations due to the initial jump. The more informative metric is the point where CDF=0.9 (90th percentile).
### Interpretation
This CDF chart demonstrates the performance characteristic of a system where "window size" is a key parameter. The data suggests:
* **Efficiency of Smaller Windows:** Smaller window sizes (e.g., 32) are associated with a much lower computational overhead in terms of recomputed tokens. Over 90% of requests with a window size of 32 require fewer than ~100 recomputed tokens.
* **Cost of Larger Context:** Increasing the window size to 256 dramatically increases the potential computational cost. While 60% of requests still incur near-zero cost, the remaining 40% have a much wider and higher distribution of recomputed tokens, with a non-trivial probability of requiring over 1000 tokens to be recomputed.
* **System Design Implication:** The chart visualizes a trade-off. A larger window size likely provides the system (e.g., a language model or cache) with more context, which may improve output quality. However, this comes at the cost of significantly higher and more variable computational work (recomputation) per request. The long tail for Window Size=256 indicates that outlier requests can be very expensive.
* **The 60% Baseline:** The consistent jump to CDF≈0.6 at X=0 is a critical finding. It implies that for a majority of requests, the window size parameter has no impact on recomputation cost, likely because the request is simple or the necessary context is already cached. The parameter's cost impact is only felt by the minority of more complex requests.