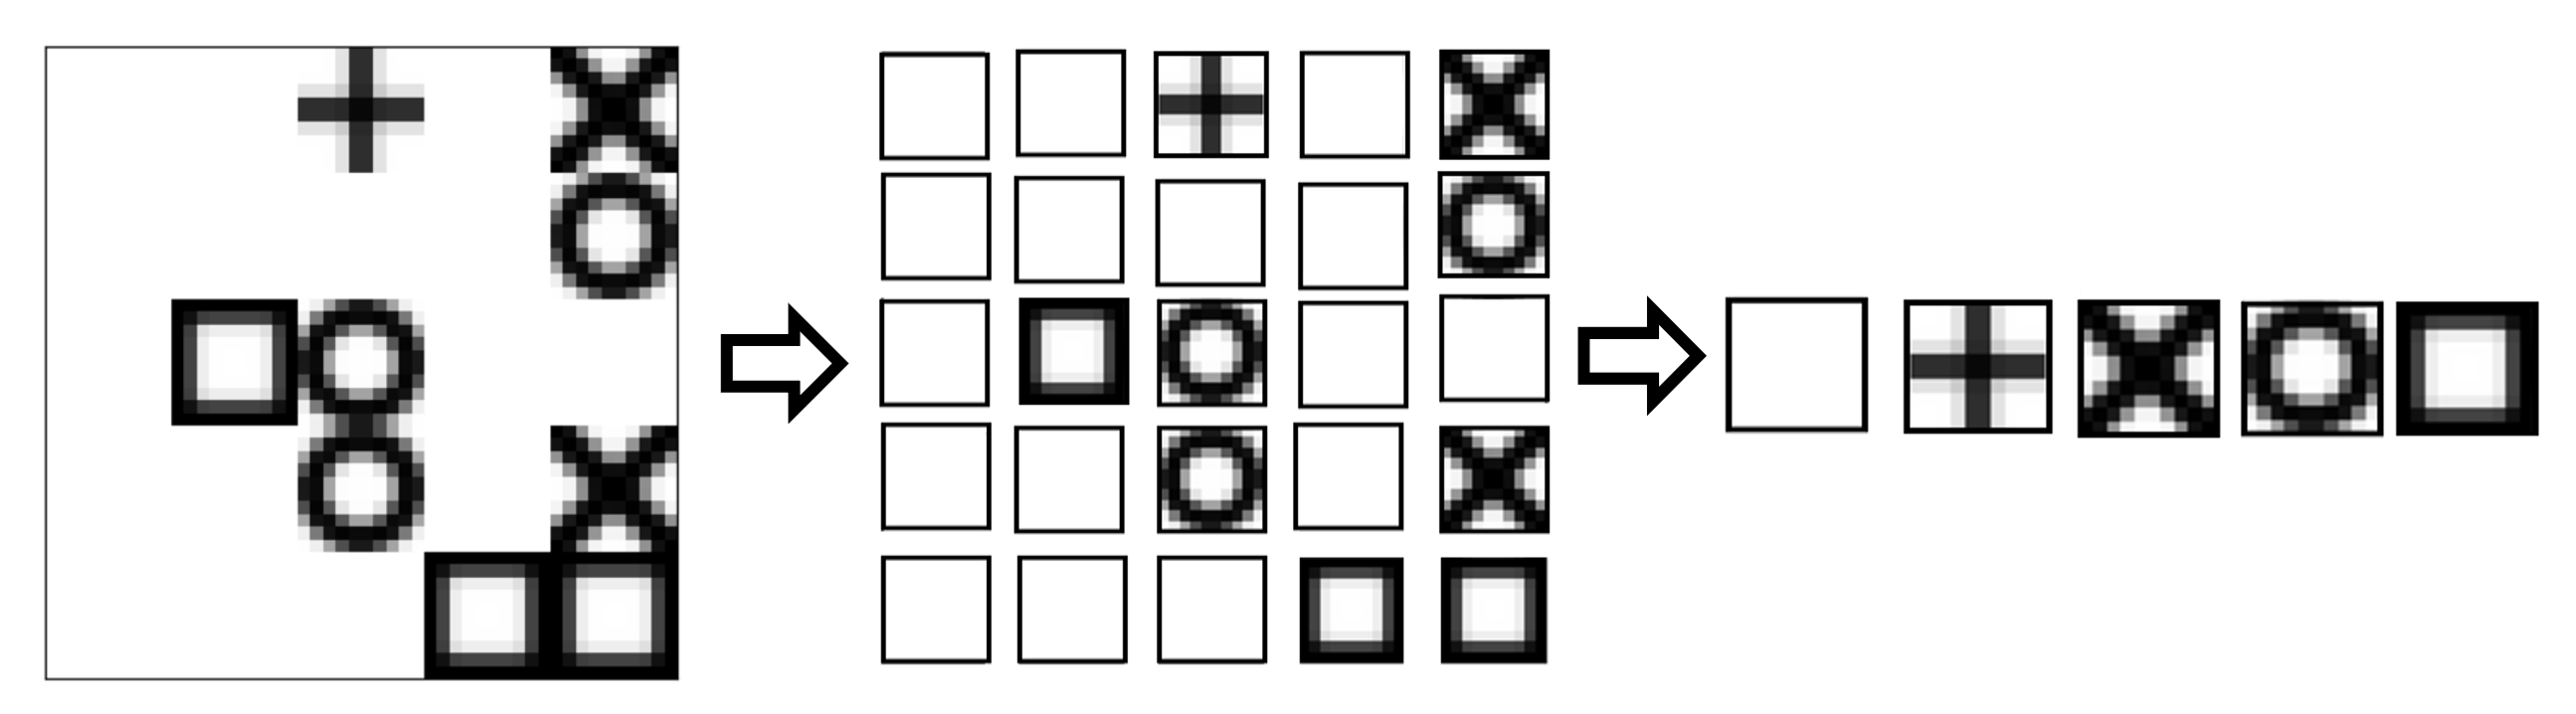
## Diagram: Symbol Sorting and Categorization Process
### Overview
The image illustrates a three-stage process involving a 5x5 grid of symbols. The process begins with an unsorted 5x5 grid of mixed symbols, transitions to a 5x5 grid where the symbols are organized or grouped, and concludes with a 1x5 row that acts as a legend or summary of the unique symbol types present in the grids.
### Components/Axes
* **Left Grid (Input):** A 5x5 matrix containing a mix of four distinct symbols and empty cells.
* **Middle Grid (Processed):** A 5x5 matrix containing the same symbols as the left grid, but rearranged into a structured, grouped format.
* **Right Row (Legend/Summary):** A 1x5 horizontal sequence displaying the unique symbols found in the grids, ordered from left to right: [Empty Square, Plus, Cross, Circle, Filled Square].
* **Arrows:** Two large arrows pointing from left to right, indicating the flow of the transformation process.
### Detailed Analysis
#### 1. Left Grid (Input)
The grid contains 25 cells. The distribution of symbols is as follows:
* **Plus (+):** 1 instance (Row 1, Column 3)
* **Cross (X):** 3 instances (Row 1, Column 5; Row 2, Column 5; Row 4, Column 5)
* **Circle (O):** [Description truncated in source]