## Diagram: Symbol Transformation Process
### Overview
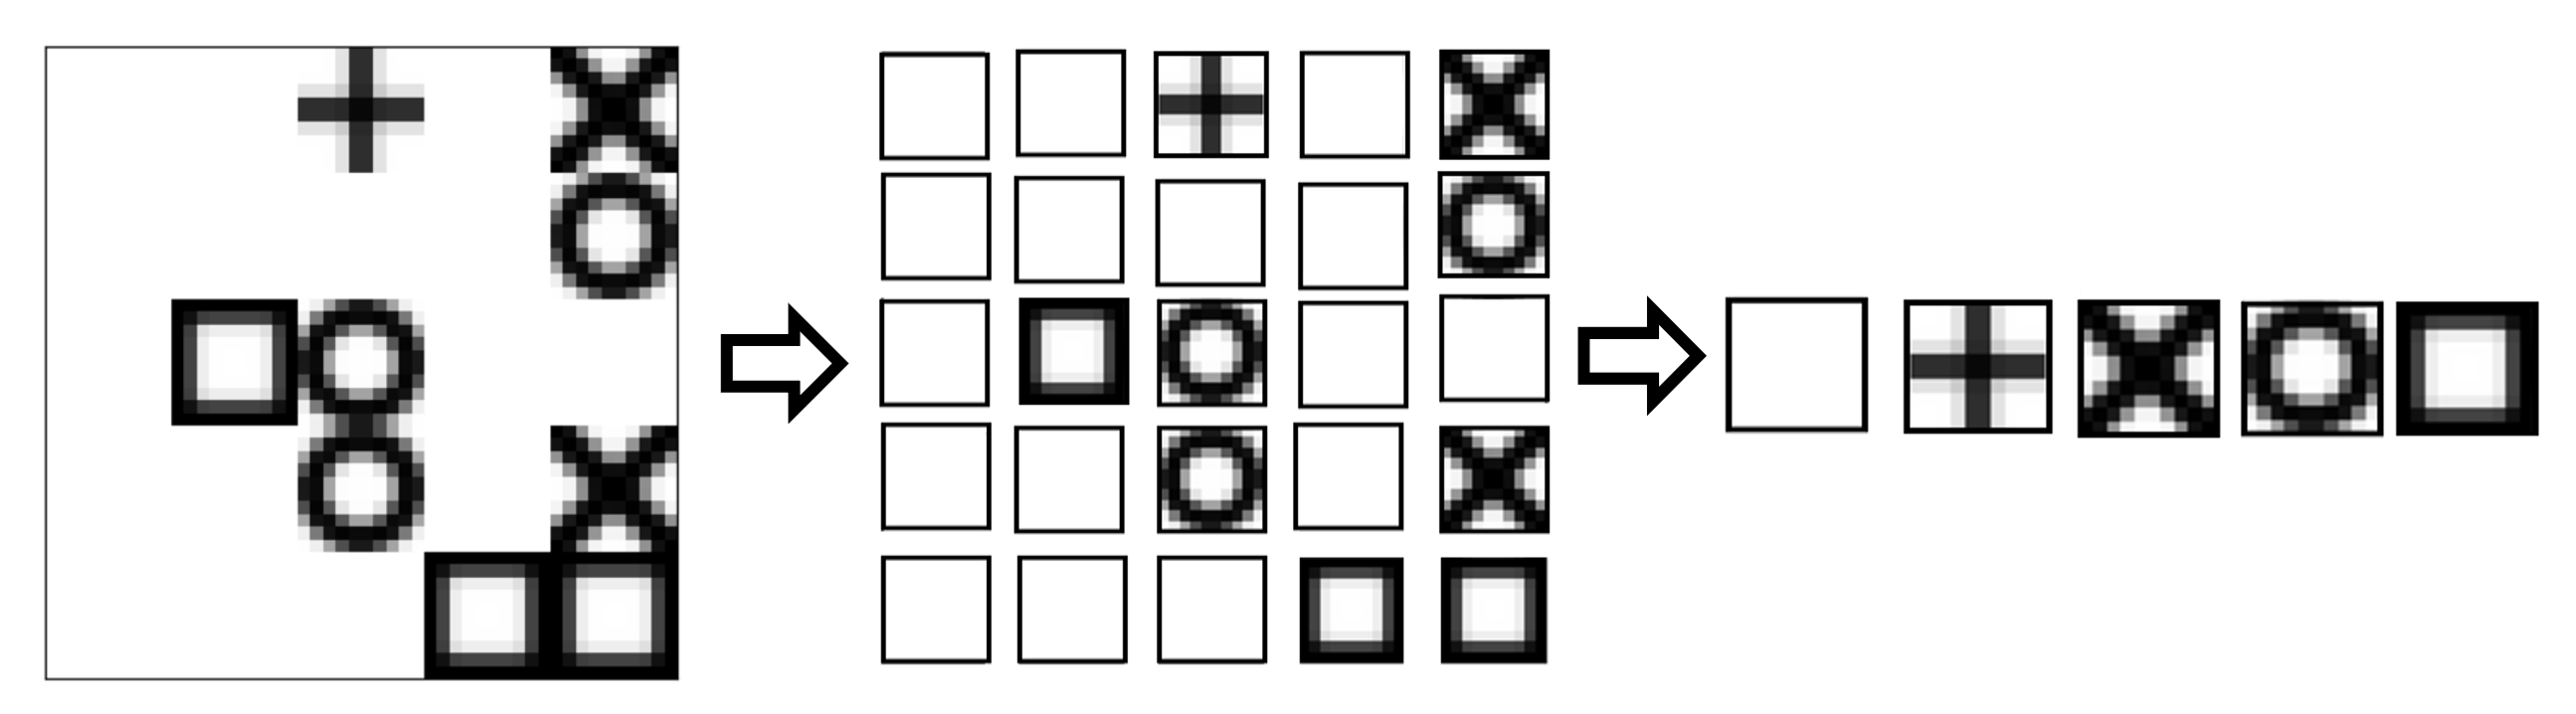
The image illustrates a three-stage transformation process, moving from a sparse 3x3 grid of symbols, through an intermediate 5x5 grid with empty cells, to a final linear sequence of five symbols. The process is depicted left-to-right, connected by block arrows indicating the direction of transformation. The diagram contains no textual labels, axis titles, or numerical data. It is a purely visual, symbolic representation of a mapping or extraction operation.
### Components/Axes
The diagram consists of three distinct visual components arranged horizontally:
1. **Left Component (Input Grid):** A 3x3 grid containing various pixelated symbols.
2. **Middle Component (Intermediate Grid):** A 5x5 grid containing a subset of the symbols from the left grid, placed in specific cells, with many cells left empty (white squares with black borders).
3. **Right Component (Output Sequence):** A horizontal row of five symbols, representing the final output.
4. **Connectors:** Two right-pointing block arrows (`→`) connect the left grid to the middle grid, and the middle grid to the right sequence.
### Detailed Analysis
**1. Left Input Grid (3x3):**
* **Top Row:** A plus sign (`+`) in the center cell. An 'X' shape in the right cell.
* **Middle Row:** A square with a thick black border in the left cell. A circle in the center cell. The right cell is empty (white).
* **Bottom Row:** A circle in the left cell. An 'X' shape in the center cell. A square with a thick black border in the right cell.
**2. Middle Intermediate Grid (5x5):**
This grid appears to be a spatial expansion or re-sampling of the input. Symbols are placed in specific coordinates, with empty cells filling the rest.
* **Row 1 (Top):** Empty, Empty, Plus sign (`+`), Empty, 'X' shape.
* **Row 2:** Empty, Empty, Empty, Empty, Circle.
* **Row 3:** Empty, Square (thick border), Circle, Empty, Empty.
* **Row 4:** Empty, Empty, Circle, Empty, 'X' shape.
* **Row 5 (Bottom):** Empty, Empty, Empty, Square (thick border), Square (thick border).
**3. Right Output Sequence:**
A linear, ordered list of five symbols. From left to right:
1. Empty square (white with black border).
2. Plus sign (`+`).
3. 'X' shape.
4. Circle.
5. Square with a thick black border.
### Key Observations
* **Symbol Set:** The process uses four distinct symbol types: Plus (`+`), 'X' shape, Circle, and Square (thick border). An "empty" state is also a key element.
* **Spatial Transformation:** The transformation is not a simple one-to-one mapping. The 3x3 input is mapped to a 5x5 intermediate grid, suggesting a process like convolution, padding, or feature map expansion common in image processing or neural networks.
* **Output Flattening:** The final step collapses the 2D intermediate grid into a 1D sequence. The order in the output sequence (Empty, +, X, Circle, Square) does not directly correspond to a simple row-major or column-major reading of the middle grid.
* **Symbol Conservation:** All four symbol types from the input grid appear in the final output sequence. The input contains two squares, two circles, one plus, and two X's. The output contains one of each symbol type plus an empty square.
### Interpretation
This diagram visually conceptualizes a data transformation pipeline, likely inspired by operations in computer vision or symbolic computation.
* **What it Suggests:** The process demonstrates how spatially arranged data (the 3x3 grid) is first expanded or processed into a larger, sparser representation (the 5x5 grid), and then distilled into a fixed-length, ordered feature vector (the 5-element sequence). This is a fundamental pattern in machine learning, where raw input is transformed into a latent representation.
* **Relationships:** The arrows define a clear, irreversible flow of information. The middle grid acts as an intermediate representation or "feature map." The final sequence could represent an encoded summary, a set of detected features, or a flattened tensor ready for further processing.
* **Notable Patterns/Anomalies:**
* The placement in the 5x5 grid seems deliberate but its logic isn't immediately obvious from the symbols alone. It may represent the application of a specific kernel or filter.
* The final output sequence is not a direct serialization of the middle grid. The empty square appears first, which might represent a bias term, a padding token, or the result of a specific aggregation function (e.g., taking the most frequent "background" state).
* The diagram abstracts away the *mechanism* of transformation, focusing instead on the change in data structure and representation. It serves as a high-level schematic for a technical process rather than a detailed algorithm specification.