## Flowchart Diagram: Symbol Processing Stages
### Overview
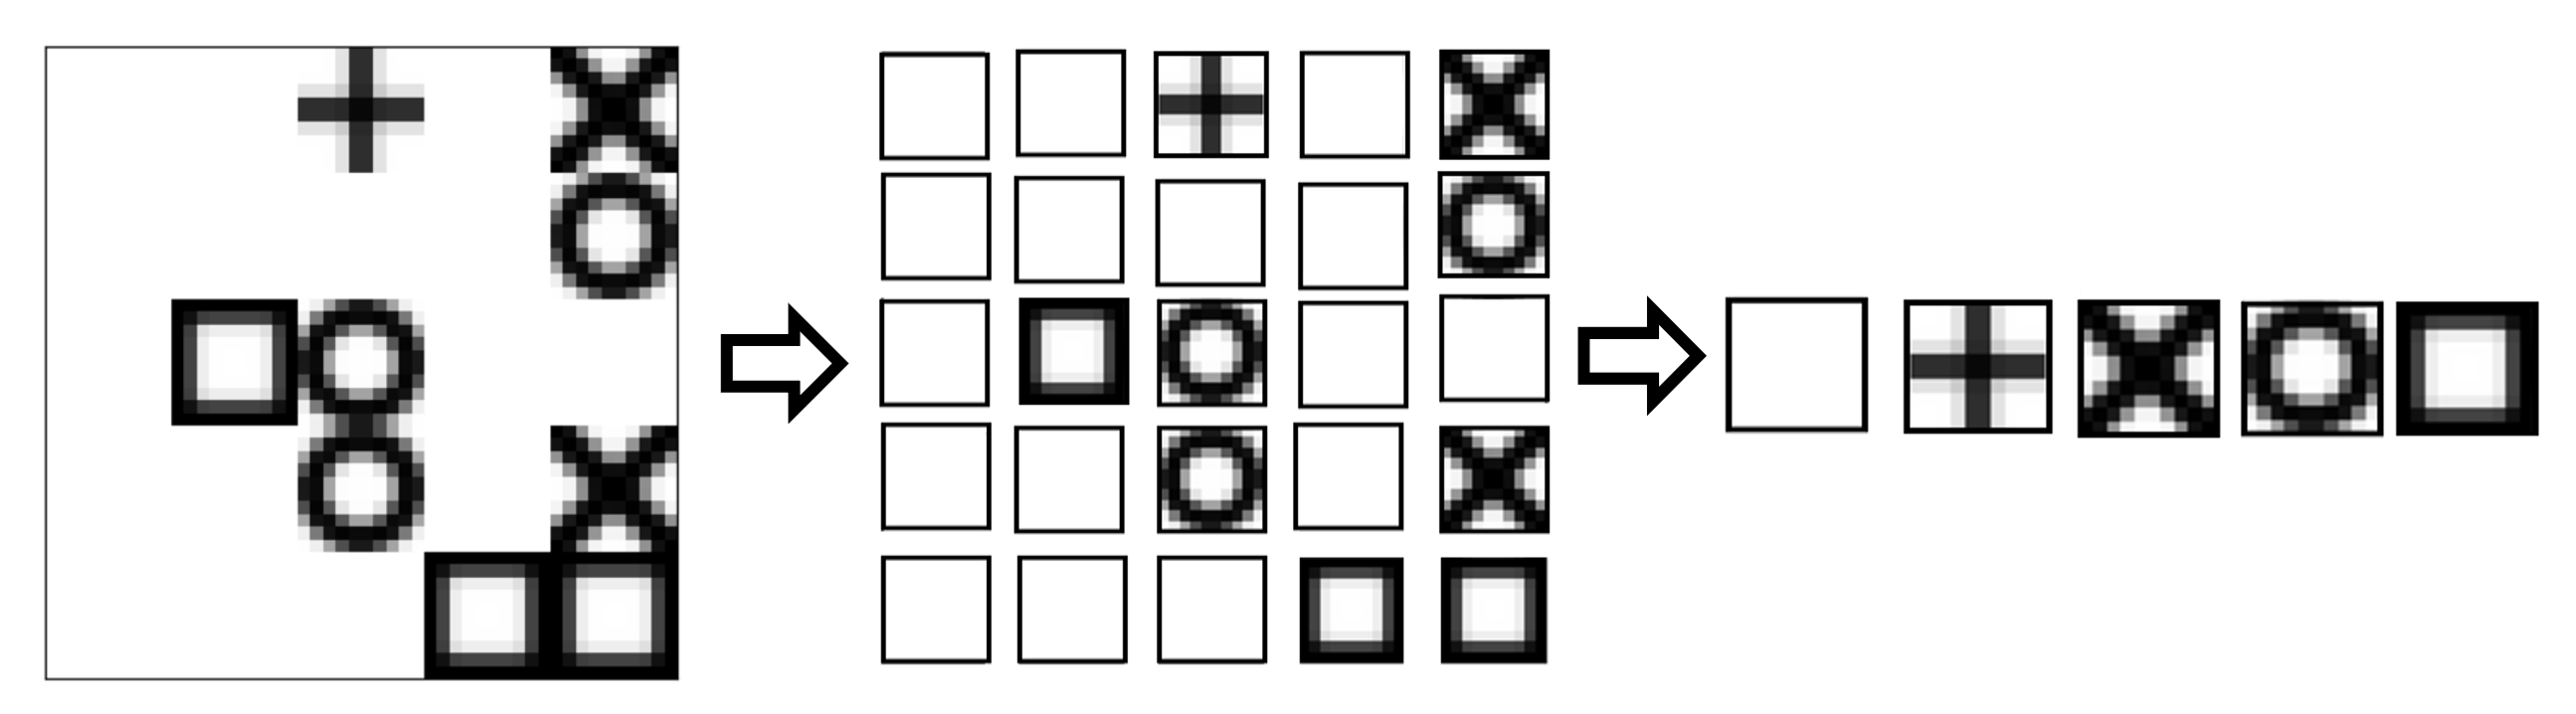
The image depicts a three-stage flowchart illustrating the transformation of symbols through a structured process. Each stage is represented by a grid of cells containing symbols, with directional arrows indicating progression between stages. No textual labels, legends, or numerical data are present in the diagram.
### Components/Axes
1. **Stage 1 (Input Grid)**:
- A 3x3 grid containing symbols: `+`, `X`, `O`, and squares.
- Symbols are arranged in a seemingly random pattern with no discernible grouping.
2. **Stage 2 (Intermediate Grid)**:
- A 9x3 grid where each cell contains a single symbol from Stage 1.
- Symbols are distributed uniformly across the grid, with no apparent repetition or pattern.
3. **Stage 3 (Output Grid)**:
- A 1x4 grid displaying four symbols: `+`, `X`, `O`, and a square.
- Symbols are ordered sequentially from left to right.
4. **Arrows**:
- Black arrows with white outlines connect Stage 1 → Stage 2 → Stage 3, indicating a unidirectional flow.
### Detailed Analysis
- **Stage 1**: The 3x3 grid serves as the input, with symbols occupying specific positions. For example:
- Top-left cell: `+`
- Top-middle cell: `X`
- Bottom-right cell: Square
- **Stage 2**: The 9x3 grid expands the input into a larger structure. Each cell contains one symbol from Stage 1, but no aggregation or transformation rules are visible.
- **Stage 3**: The final output grid simplifies the process to four distinct symbols, suggesting a reduction or categorization step.
### Key Observations
1. **Symbol Consistency**: All symbols (`+`, `X`, `O`, squares) appear in all stages, indicating they are preserved through the process.
2. **Grid Dimensionality**: The progression from 3x3 → 9x3 → 1x4 grids implies increasing complexity followed by simplification.
3. **No Data-Driven Logic**: The absence of numerical values or explicit rules suggests the flowchart represents a conceptual or procedural flow rather than data analysis.
### Interpretation
The diagram likely represents a symbolic processing pipeline, such as:
1. **Input Encoding**: Stage 1 defines a set of symbols (e.g., user inputs or predefined tokens).
2. **Expansion/Mapping**: Stage 2 distributes symbols across a larger grid, possibly simulating parallel processing or state transitions.
3. **Output Synthesis**: Stage 3 condenses the process into a final set of symbols, potentially representing outcomes or decisions.
The lack of numerical data or explicit rules implies the flowchart is a high-level abstraction, possibly used to illustrate algorithmic steps, decision trees, or symbolic logic systems. The uniformity of symbols across stages suggests no loss or alteration of information during processing.