## Bar Charts with Scatter Plots: Fault Rate Outcomes and PPL Deviation
### Overview
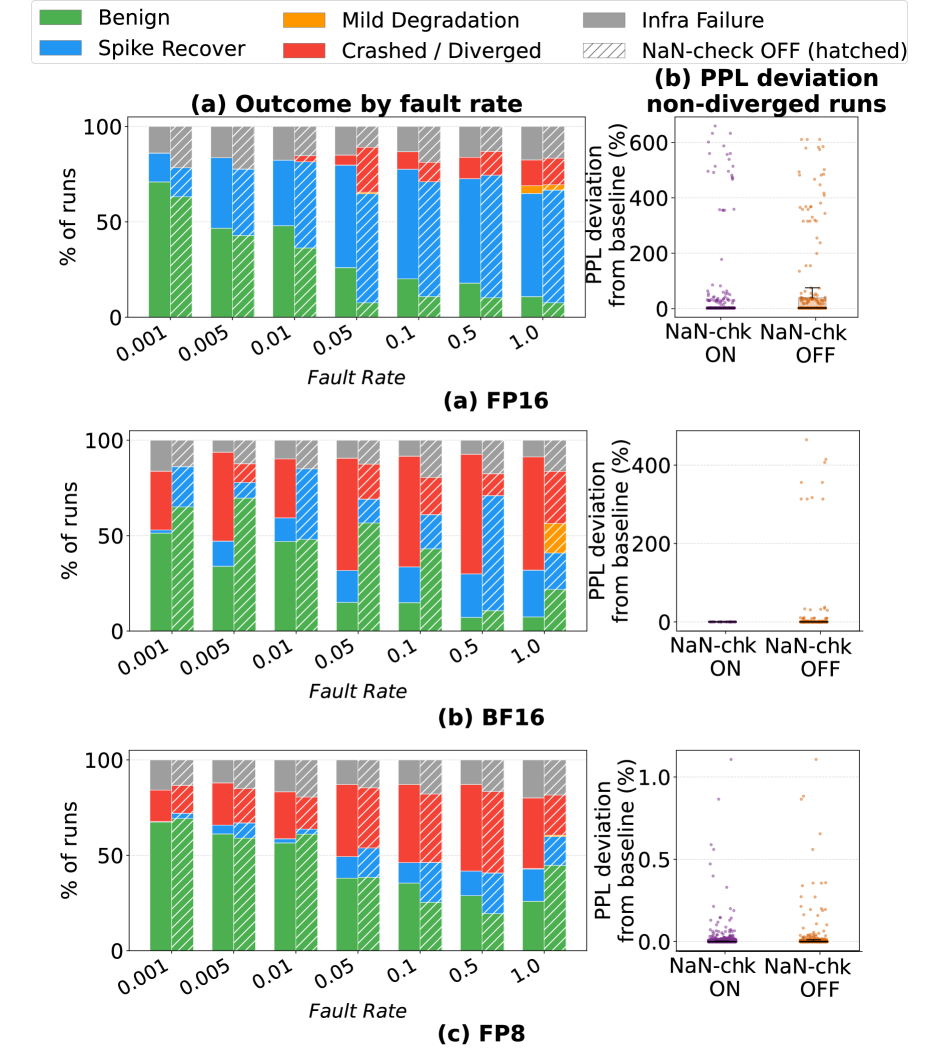
The image presents three comparative analyses (FP16, BF16, FP8) of system outcomes across varying fault rates (0.001 to 1.0). Each section includes:
1. A stacked bar chart showing outcome distributions by fault rate
2. A scatter plot comparing PPL deviation from baseline with NaN-check status
### Components/Axes
**Legend (Top-left):**
- Green: Benign
- Orange: Mild Degradation
- Blue: Spike Recover
- Red: Crashed/Diverged
- Gray: Infra Failure
- Hatched: NaN-check OFF
**Bar Chart Axes:**
- X-axis: Fault Rate (0.001, 0.005, 0.01, 0.05, 0.1, 0.5, 1.0)
- Y-axis: % of runs (0-100%)
**Scatter Plot Axes:**
- X-axis: Fault Rate (0.001-1.0)
- Y-axis: PPL deviation from baseline (%)
- Categories: NaN-check ON (left), NaN-check OFF (right)
### Detailed Analysis
**FP16 Section:**
- **Bar Chart Trends:**
- At 0.001 fault rate: ~65% Benign (green), ~25% Spike Recover (blue), ~10% Crashed (red)
- At 1.0 fault rate: ~15% Benign, ~35% Crashed, ~40% Spike Recover
- **Scatter Plot:**
- NaN-check ON: Points cluster near 0-100% deviation
- NaN-check OFF: Points show higher spread (up to 600% deviation)
**BF16 Section:**
- **Bar Chart Trends:**
- At 0.01 fault rate: ~50% Benign, ~30% Spike Recover, ~20% Crashed
- At 0.5 fault rate: ~20% Benign, ~50% Crashed, ~30% Spike Recover
- **Scatter Plot:**
- NaN-check OFF shows systematic increase in deviation with fault rate
**FP8 Section:**
- **Bar Chart Trends:**
- At 0.1 fault rate: ~40% Benign, ~40% Spike Recover, ~20% Crashed
- At 1.0 fault rate: ~10% Benign, ~60% Crashed, ~30% Spike Recover
- **Scatter Plot:**
- NaN-check OFF points show exponential deviation growth
### Key Observations
1. **Fault Rate Correlation:**
- Benign outcomes decrease monotonically with increasing fault rate (FP16: 65%→15%, BF16: 50%→20%, FP8: 40%→10%)
- Crashed/Diverged outcomes increase sharply after 0.1 fault rate (FP8: 20%→60%)
2. **NaN-check Impact:**
- OFF condition consistently shows higher PPL deviations (FP16: up to 600%, BF16: up to 400%, FP8: up to 100%)
- ON condition maintains tighter deviation clusters (<200%)
3. **Color Consistency:**
- Red segments (Crashed) dominate at high fault rates (FP8 1.0: 60% red)
- Hatched patterns (NaN-check OFF) appear only in scatter plots
### Interpretation
The data demonstrates a clear degradation cascade:
1. **System Stability:** Higher fault rates correlate with increased system failures (Crashed/Diverged), suggesting threshold effects at 0.1-0.5 fault rates
2. **Error Propagation:** NaN-check OFF condition amplifies performance deviations, particularly in FP16 (600% max deviation) and BF16 (400% max)
3. **Recovery Mechanisms:** "Spike Recover" category acts as a buffer zone between benign and catastrophic failure, becoming more prominent at moderate fault rates (0.05-0.5)
The consistent pattern across all three architectures (FP16, BF16, FP8) indicates fundamental limitations in fault tolerance that NaN-check mechanisms help mitigate. The exponential deviation growth in FP8's scatter plot suggests architectural sensitivity to error propagation mechanisms.