## Heatmap: Shorter Inferences
### Overview
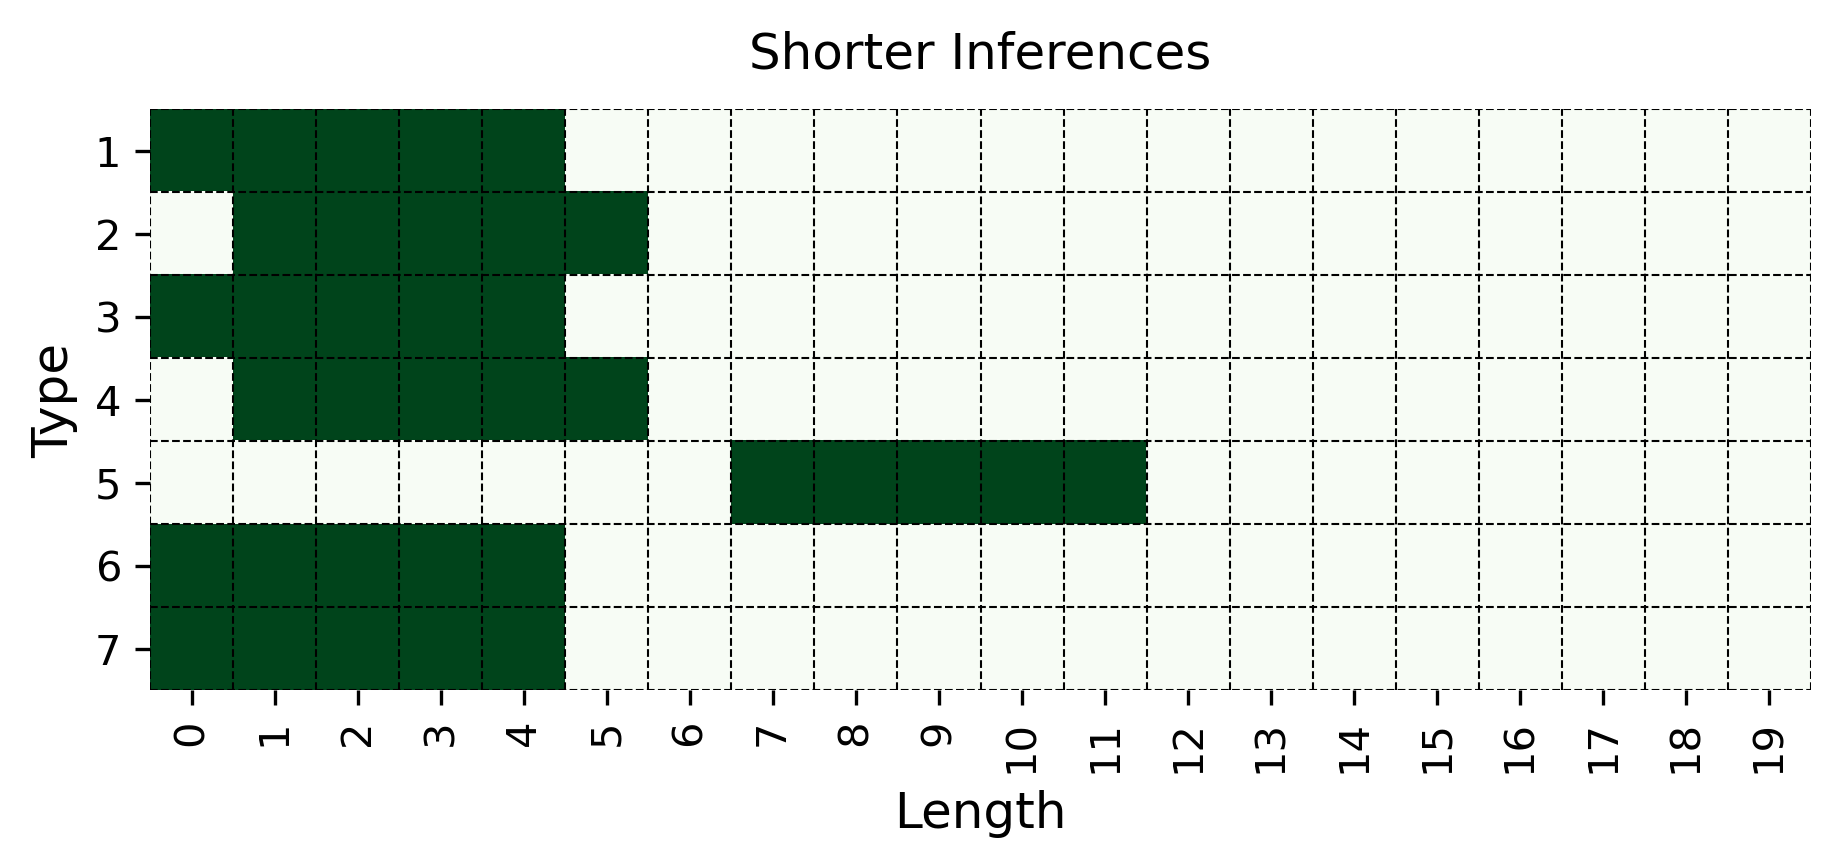
The image is a heatmap titled "Shorter Inferences." It visualizes the presence or intensity of data across two categorical/ordinal dimensions: "Type" (y-axis) and "Length" (x-axis). The chart uses a binary color scheme where dark green blocks indicate a positive value or presence for a given (Type, Length) pair, and the white background indicates absence or zero value.
### Components/Axes
* **Title:** "Shorter Inferences" (centered at the top).
* **Y-Axis (Vertical):**
* **Label:** "Type" (rotated 90 degrees, positioned to the left of the axis).
* **Categories/Ticks:** Seven discrete types, labeled from top to bottom as: 1, 2, 3, 4, 5, 6, 7.
* **X-Axis (Horizontal):**
* **Label:** "Length" (centered below the axis).
* **Scale/Ticks:** A linear scale from 0 to 19, with integer markers at every unit (0, 1, 2, ..., 19).
* **Grid:** A dashed grid is overlaid on the plot area, aligning with each integer tick on both axes.
* **Legend/Color Key:** No explicit legend is present. The color (dark green) is used uniformly to represent the presence of data. The absence of color (white) represents the absence of data.
### Detailed Analysis
The heatmap displays a sparse matrix where each row (Type) has a specific, contiguous range of "Length" values marked with dark green blocks.
* **Type 1:** Active for Lengths **0, 1, 2, 3, 4**. (A continuous block from 0 to 4).
* **Type 2:** Active for Lengths **1, 2, 3, 4, 5**. (A continuous block from 1 to 5; note the absence at Length 0).
* **Type 3:** Active for Lengths **0, 1, 2, 3, 4**. (Identical pattern to Type 1).
* **Type 4:** Active for Lengths **1, 2, 3, 4, 5**. (Identical pattern to Type 2).
* **Type 5:** Active for Lengths **7, 8, 9, 10, 11**. (A continuous block from 7 to 11; this is the only type with lengths significantly greater than 5).
* **Type 6:** Active for Lengths **0, 1, 2, 3, 4**. (Identical pattern to Types 1 and 3).
* **Type 7:** Active for Lengths **0, 1, 2, 3, 4**. (Identical pattern to Types 1, 3, and 6).
**Spatial Summary:** The data is heavily concentrated in the left portion of the chart (Lengths 0-5). There is a distinct cluster for Types 1, 3, 6, and 7 (Lengths 0-4) and a slightly offset cluster for Types 2 and 4 (Lengths 1-5). Type 5 is a clear outlier, forming an isolated cluster in the middle of the x-axis (Lengths 7-11). The right side of the chart (Lengths 12-19) is entirely empty.
### Key Observations
1. **Bimodal Distribution:** The data shows two primary clusters of activity: one at very short lengths (0-5) and a secondary, isolated cluster at moderate lengths (7-11).
2. **Type Grouping:** The seven types fall into three distinct behavioral groups based on their length profiles:
* **Group A (Shortest):** Types 1, 3, 6, 7 (Lengths 0-4).
* **Group B (Short):** Types 2, 4 (Lengths 1-5).
* **Group C (Moderate):** Type 5 (Lengths 7-11).
3. **Uniformity within Groups:** Within Groups A and B, the patterns are perfectly uniform. All members of Group A have identical active ranges, as do all members of Group B.
4. **Significant Gap:** There is a complete absence of data for any type at Lengths 5 and 6, creating a clear separation between the short-length cluster and the moderate-length cluster of Type 5.
5. **No Long Inferences:** No type shows any activity for lengths 12 and above.
### Interpretation
This heatmap likely represents the distribution of inference lengths (e.g., number of reasoning steps, sequence length, or token count) for different categories or models ("Types").
* **What the data suggests:** The title "Shorter Inferences" is strongly supported by the data. The vast majority of inferences across all types are very short (≤5 units). Type 5 is the sole exception, producing moderately longer inferences (7-11 units), but still not "long" relative to the full scale (0-19).
* **Relationship between elements:** The "Type" appears to be a strong determinant of inference length. The perfect grouping suggests that Types 1, 3, 6, and 7 may be variants of the same underlying model or process, as are Types 2 and 4. Type 5 represents a fundamentally different approach or category that consistently generates longer, but still bounded, inferences.
* **Notable anomalies:** The complete gap at lengths 5 and 6 is striking. It implies a potential threshold or discontinuity in the process generating these inferences. Inferences either terminate very quickly (≤5) or, if they pass a certain point, tend to continue to at least length 7. The absence of any data beyond length 11 suggests a hard constraint or a natural termination point for even the longest inferences in this dataset.
* **Peircean Investigative Reading:** The chart is an *index* of a process's behavior, pointing directly to its operational constraints. It is also a *symbol* of efficiency or simplicity, visually arguing that the system(s) under study predominantly operate with minimal steps. The outlier (Type 5) serves as a critical *icon* of a different, more complex operational mode within the same framework.