## Line Graph: Validation Reward vs. Training Steps
### Overview
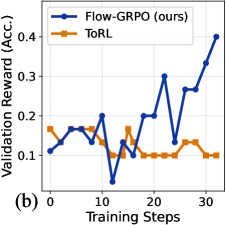
The image depicts a line graph comparing the validation reward (accuracy) of two models, "Flow-GRPO (ours)" and "ToRL," across 30 training steps. The graph highlights performance trends, with Flow-GRPO showing higher variability but a significant upward trend, while ToRL remains relatively stable but lower in value.
### Components/Axes
- **X-axis (Training Steps)**: Labeled "Training Steps," with markers at 0, 10, 20, and 30.
- **Y-axis (Validation Reward)**: Labeled "Validation Reward (Acc.)," scaled from 0.1 to 0.4 in increments of 0.1.
- **Legend**: Positioned in the top-left corner, with:
- **Blue line**: "Flow-GRPO (ours)"
- **Orange line**: "ToRL"
### Detailed Analysis
1. **Flow-GRPO (Blue Line)**:
- Starts at ~0.12 at step 0.
- Peaks at ~0.3 at step 20.
- Dips to ~0.1 at step 15.
- Sharp rise to ~0.4 by step 30.
- **Trend**: Overall upward trajectory with volatility, especially after step 20.
2. **ToRL (Orange Line)**:
- Begins at ~0.15 at step 0.
- Drops to ~0.1 at step 10.
- Remains flat at ~0.1 until step 20.
- Slight increase to ~0.12 at step 30.
- **Trend**: Stable but low performance, with minimal improvement over time.
### Key Observations
- Flow-GRPO exhibits higher validation rewards, particularly after step 20, with a sharp increase near the end.
- ToRL’s performance plateaus early and remains below Flow-GRPO throughout.
- Flow-GRPO’s volatility suggests potential instability during training but ultimately outperforms ToRL.
### Interpretation
The data suggests that Flow-GRPO demonstrates superior performance in later training stages, possibly due to adaptive learning mechanisms or optimization strategies. Its sharp rise after step 20 may indicate a critical phase where the model effectively leverages training data. In contrast, ToRL’s stagnant performance implies limited scalability or convergence issues. The graph underscores the importance of model architecture or training dynamics in achieving higher validation rewards, with Flow-GRPO’s volatility potentially reflecting a trade-off between exploration and exploitation during training.