## Line Chart: Validation Reward vs. Training Steps
### Overview
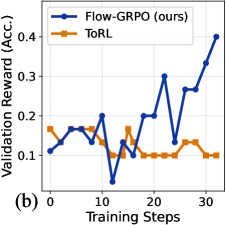
The image is a line chart comparing the validation reward (accuracy) of two algorithms, "Flow-GRPO (ours)" and "ToRL", over a series of training steps. The chart displays the performance of each algorithm as a function of training steps, allowing for a visual comparison of their learning curves.
### Components/Axes
* **Y-axis:** "Validation Reward (Acc.)" with a scale from 0.1 to 0.4, incrementing by 0.1.
* **X-axis:** "Training Steps" with a scale from 0 to 30, incrementing by 10.
* **Legend:** Located in the top-left corner.
* Blue line: "Flow-GRPO (ours)"
* Orange line: "ToRL"
* **Title:** Implicit, but the chart compares the validation reward of two algorithms over training steps.
* **Subtitle:** (b) in the bottom left corner.
### Detailed Analysis
* **Flow-GRPO (ours) (Blue Line):**
* Trend: Generally increasing with significant fluctuations.
* Data Points:
* At 0 Training Steps: approximately 0.11
* At 5 Training Steps: approximately 0.17
* At 10 Training Steps: approximately 0.20
* At 12 Training Steps: approximately 0.04
* At 15 Training Steps: approximately 0.13
* At 18 Training Steps: approximately 0.20
* At 22 Training Steps: approximately 0.30
* At 25 Training Steps: approximately 0.13
* At 27 Training Steps: approximately 0.27
* At 30 Training Steps: approximately 0.35
* At 32 Training Steps: approximately 0.40
* **ToRL (Orange Line):**
* Trend: Relatively stable with minor fluctuations, then decreasing slightly at the end.
* Data Points:
* At 0 Training Steps: approximately 0.17
* At 5 Training Steps: approximately 0.17
* At 10 Training Steps: approximately 0.13
* At 15 Training Steps: approximately 0.17
* At 20 Training Steps: approximately 0.10
* At 25 Training Steps: approximately 0.10
* At 30 Training Steps: approximately 0.10
* At 32 Training Steps: approximately 0.10
### Key Observations
* Flow-GRPO shows a generally increasing trend in validation reward as training steps increase, but with significant volatility.
* ToRL maintains a relatively stable validation reward throughout the training steps, with a slight decrease towards the end.
* Flow-GRPO outperforms ToRL significantly in the later training steps.
### Interpretation
The chart suggests that Flow-GRPO, while initially performing similarly to ToRL, eventually surpasses ToRL in terms of validation reward (accuracy) as training progresses. The fluctuations in Flow-GRPO's performance indicate that it may be more sensitive to specific training steps or data batches, but its overall upward trend suggests that it is learning and improving over time. ToRL, on the other hand, exhibits more stable performance, but its validation reward plateaus and even decreases slightly, indicating that it may not be learning as effectively as Flow-GRPO in this particular scenario. The data demonstrates that Flow-GRPO is a better choice for this task.