\n
## Line Chart: Validation Reward vs. Training Steps
### Overview
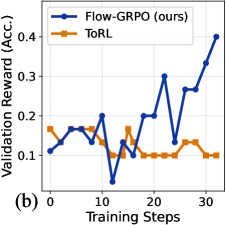
This image presents a line chart comparing the validation reward achieved by two reinforcement learning algorithms, Flow-GRPO (labeled as "ours") and ToRL, over a series of training steps. The chart displays the relationship between training progress (x-axis) and the resulting validation reward (y-axis).
### Components/Axes
* **X-axis:** "Training Steps" ranging from 0 to approximately 35. The axis is marked with tick intervals at 0, 10, 20, and 30.
* **Y-axis:** "Validation Reward (Acc.)" ranging from 0.05 to 0.45. The axis is marked with tick intervals at 0.1, 0.2, 0.3, and 0.4.
* **Legend:** Located in the top-left corner of the chart.
* **Flow-GRPO (ours):** Represented by a solid blue line with circular markers.
* **ToRL:** Represented by a solid orange line with circular markers.
* **Label:** "(b)" is present in the bottom-left corner.
### Detailed Analysis
* **Flow-GRPO (ours) - Blue Line:** The line starts at approximately 0.12 at Training Step 0. It fluctuates between approximately 0.15 and 0.22 until Training Step 15. From Training Step 15 to 30, the line exhibits a strong upward trend, increasing from approximately 0.18 to 0.32. Finally, it rises sharply to approximately 0.41 at Training Step 35.
* **ToRL - Orange Line:** The line begins at approximately 0.17 at Training Step 0. It decreases to approximately 0.11 at Training Step 5, then increases to approximately 0.18 at Training Step 10. From Training Step 10 to 20, the line fluctuates around 0.15. After Training Step 20, the line remains relatively stable, fluctuating between approximately 0.12 and 0.16.
Specific Data Points (approximate):
| Training Steps | Flow-GRPO (ours) | ToRL |
|---|---|---|
| 0 | 0.12 | 0.17 |
| 5 | 0.15 | 0.11 |
| 10 | 0.22 | 0.18 |
| 15 | 0.18 | 0.15 |
| 20 | 0.21 | 0.15 |
| 25 | 0.32 | 0.12 |
| 30 | 0.36 | 0.14 |
| 35 | 0.41 | 0.16 |
### Key Observations
* Flow-GRPO consistently outperforms ToRL throughout the training process.
* The performance gap between the two algorithms widens significantly after Training Step 15.
* ToRL's validation reward plateaus after Training Step 20, while Flow-GRPO continues to improve.
* Flow-GRPO exhibits a more volatile learning curve, with larger fluctuations in validation reward, especially between Training Steps 5 and 20.
### Interpretation
The data suggests that the Flow-GRPO algorithm is more effective at learning and improving its validation reward compared to the ToRL algorithm. The increasing trend of Flow-GRPO's validation reward indicates successful learning and adaptation during training. The plateauing of ToRL's performance suggests that it may have reached its learning limit or is struggling to generalize to the validation set. The volatility in Flow-GRPO's learning curve could indicate a more sensitive algorithm that requires careful tuning of hyperparameters. The significant performance difference after Training Step 15 suggests that Flow-GRPO benefits from continued training, while ToRL does not. The label "(b)" suggests this is part of a larger figure or set of experiments.