## Line Chart: Validation Reward vs. Training Steps
### Overview
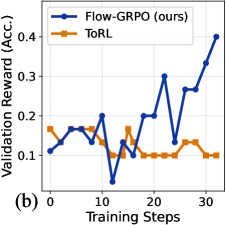
The image is a line chart comparing the performance of two methods, "Flow-GRPO (ours)" and "ToRL," over the course of training. The chart plots the validation reward (accuracy) against the number of training steps. The label "(b)" in the bottom-left corner suggests this is part of a multi-panel figure.
### Components/Axes
* **Chart Type:** Line chart with two data series.
* **X-Axis:**
* **Title:** "Training Steps"
* **Scale:** Linear, from 0 to 30.
* **Major Tick Marks:** 0, 10, 20, 30.
* **Y-Axis:**
* **Title:** "Validation Reward (Acc.)"
* **Scale:** Linear, from 0.0 to 0.4.
* **Major Tick Marks:** 0.0, 0.1, 0.2, 0.3, 0.4.
* **Legend:**
* **Position:** Top-left corner of the plot area.
* **Series 1:** "Flow-GRPO (ours)" represented by a blue line with circular markers.
* **Series 2:** "ToRL" represented by an orange line with square markers.
* **Panel Label:** "(b)" located in the bottom-left corner, outside the plot area.
### Detailed Analysis
**Data Series: Flow-GRPO (ours) - Blue Line with Circles**
* **Trend:** The line shows high volatility in the first 20 steps, with a significant dip, followed by a strong, consistent upward trend in the final 10 steps.
* **Approximate Data Points:**
* Step 0: ~0.10
* Step 5: ~0.15
* Step 10: ~0.05 (notable dip)
* Step 15: ~0.15
* Step 20: ~0.20
* Step 25: ~0.25
* Step 30: ~0.40
**Data Series: ToRL - Orange Line with Squares**
* **Trend:** The line starts higher than Flow-GRPO but exhibits a generally flat to slightly declining trend with moderate volatility. It does not show significant improvement over the training steps shown.
* **Approximate Data Points:**
* Step 0: ~0.15
* Step 5: ~0.15
* Step 10: ~0.10
* Step 15: ~0.15
* Step 20: ~0.10
* Step 25: ~0.10
* Step 30: ~0.10
### Key Observations
1. **Performance Crossover:** The Flow-GRPO method starts with a lower validation reward than ToRL but surpasses it around step 18-20.
2. **Diverging Final Performance:** By step 30, Flow-GRPO achieves a validation reward (~0.40) that is approximately four times higher than ToRL's (~0.10).
3. **Volatility:** Both methods show significant step-to-step volatility, but Flow-GRPO's volatility is coupled with a strong late-stage upward trend, while ToRL's volatility is around a stagnant or slightly decreasing mean.
4. **Critical Dip:** Flow-GRPO experiences a sharp performance drop at step 10, which it recovers from and then exceeds its previous performance.
### Interpretation
The chart demonstrates a comparative learning efficiency analysis. The "Flow-GRPO (ours)" method, despite an initial period of instability and a significant mid-training setback (step 10), exhibits a capacity for strong late-stage learning, ultimately achieving a much higher validation accuracy. In contrast, the "ToRL" method shows no clear learning progress over the 30 steps, suggesting it may have plateaued early or is less effective for this specific task.
The data suggests that the key advantage of Flow-GRPO is not in early performance but in its ability to continue improving and achieve a higher final performance ceiling. The dip at step 10 for Flow-GRPO could indicate a challenging phase in the optimization landscape or a deliberate exploration phase in its training algorithm. The chart effectively argues for the superior final performance of the proposed method (Flow-GRPO) over the baseline (ToRL) within the observed training window.