## Pie Charts: Self-Judgement and Self-Difficulty Evaluation for Qwen2.5-14B-Instruct
### Overview
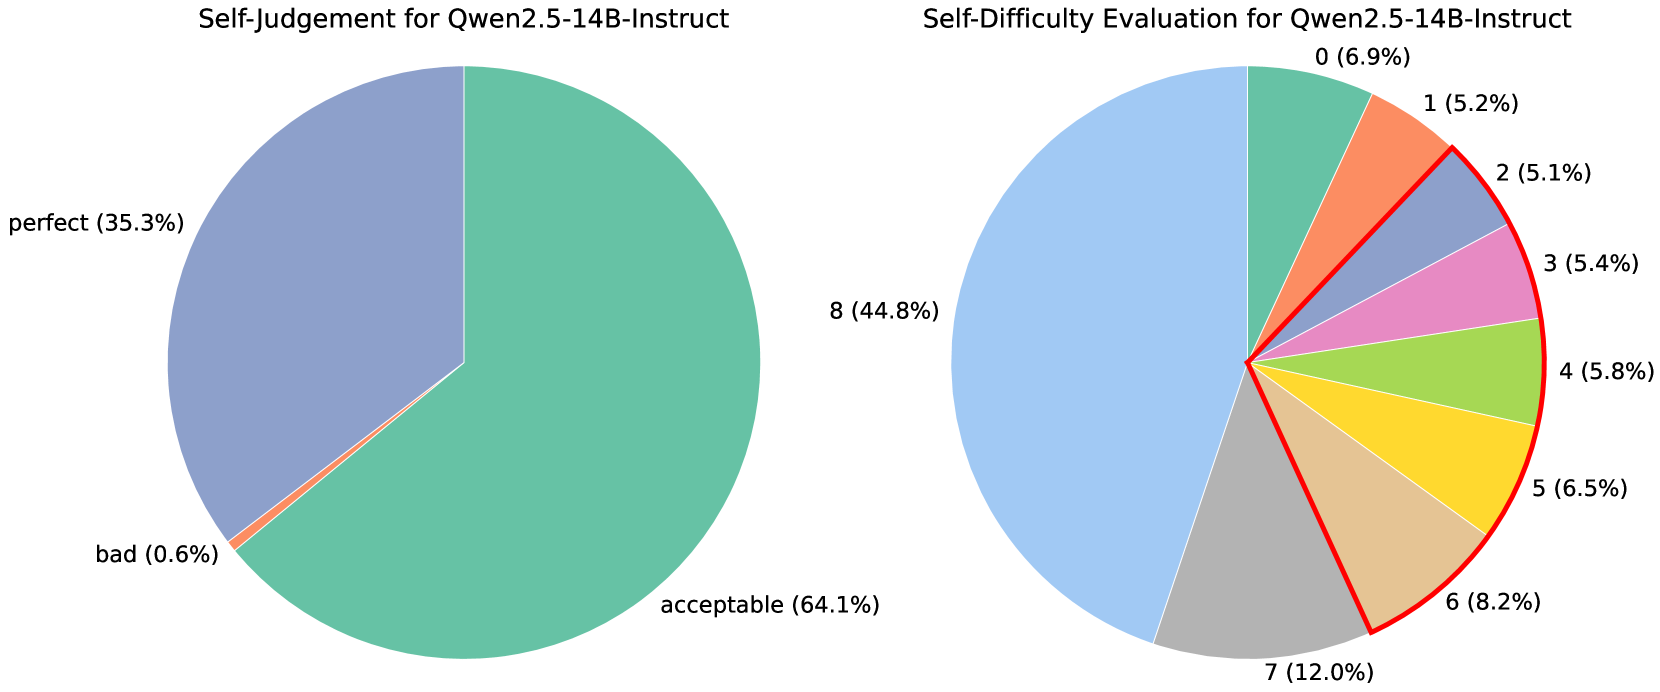
The image contains two pie charts side-by-side. The left pie chart represents "Self-Judgement for Qwen2.5-14B-Instruct," categorizing responses as "perfect," "acceptable," or "bad." The right pie chart represents "Self-Difficulty Evaluation for Qwen2.5-14B-Instruct," showing the distribution of difficulty ratings from 0 to 8.
### Components/Axes
**Left Pie Chart: Self-Judgement**
* **Title:** Self-Judgement for Qwen2.5-14B-Instruct
* **Categories:**
* perfect (light purple): 35.3%
* acceptable (light green): 64.1%
* bad (light orange): 0.6%
**Right Pie Chart: Self-Difficulty Evaluation**
* **Title:** Self-Difficulty Evaluation for Qwen2.5-14B-Instruct
* **Categories (Difficulty Ratings):**
* 0 (light green): 6.9%
* 1 (light orange): 5.2%
* 2 (light red): 5.1%
* 3 (light pink): 5.4%
* 4 (light lime green): 5.8%
* 5 (light yellow): 6.5%
* 6 (light tan): 8.2%
* 7 (light grey): 12.0%
* 8 (light blue): 44.8%
* A red line highlights the slices from 1 to 6.
### Detailed Analysis
**Left Pie Chart: Self-Judgement**
* The "acceptable" category makes up the majority of the pie chart at 64.1%.
* The "perfect" category accounts for 35.3%.
* The "bad" category is a very small fraction at 0.6%.
**Right Pie Chart: Self-Difficulty Evaluation**
* Difficulty rating "8" has the largest share at 44.8%.
* Difficulty rating "7" accounts for 12.0%.
* The remaining difficulty ratings (0-6) each account for less than 10% of the pie chart.
### Key Observations
* In the Self-Judgement chart, the vast majority of responses are categorized as "acceptable."
* In the Self-Difficulty Evaluation chart, the highest difficulty rating (8) is the most frequent.
* The red line highlights the lower difficulty ratings (1-6), which collectively represent a smaller portion of the responses compared to ratings 7 and 8.
### Interpretation
The data suggests that the Qwen2.5-14B-Instruct model is generally performing acceptably, according to self-judgement. However, the self-difficulty evaluation indicates that the model frequently encounters high levels of difficulty. The high percentage of difficulty rating "8" suggests that the model often struggles with the tasks it is given. The red line highlighting the lower difficulty ratings emphasizes that these ratings are less common, indicating that the model rarely finds the tasks easy or moderately challenging.