\n
## Chart: Proportion of Scores by Model and Category
### Overview
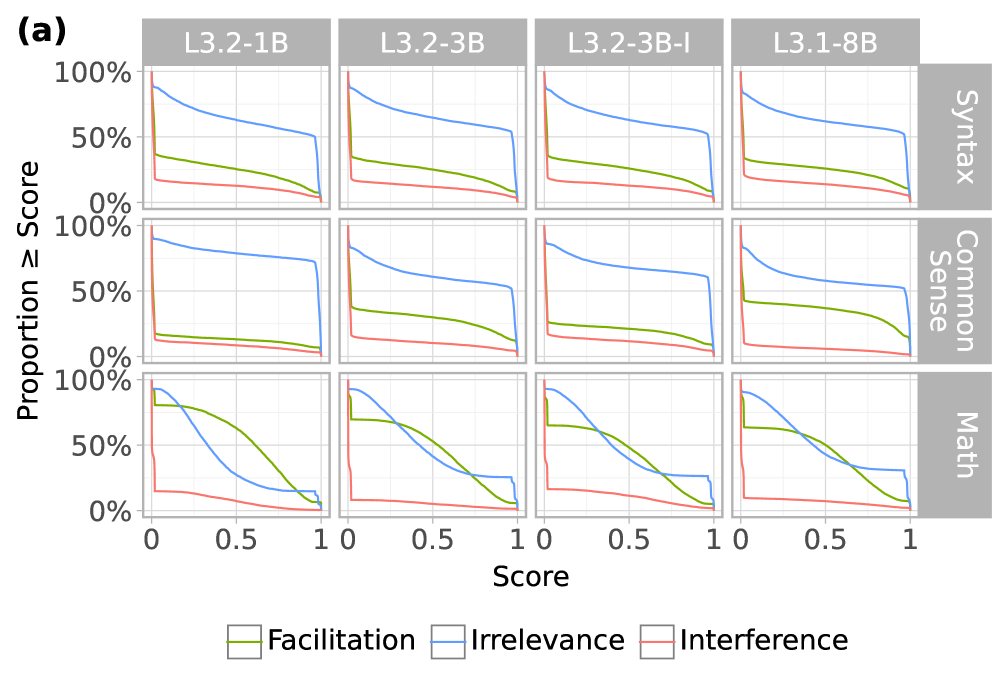
The image presents a 3x4 grid of line charts, visualizing the proportion of scores (y-axis, ranging from 0% to 100%) greater than or equal to a given score (x-axis, ranging from 0 to 1). The charts are categorized by model (L3.2-1B, L3.2-3B, L3.2-3B-I, L3.1-8B) along the top row and evaluation category (Syntax, Common Sense, Match) down the left column. Each chart displays three lines representing different phenomena: Facilitation, Irrelevance, and Interference. A legend in the bottom-center identifies the colors associated with each phenomenon.
### Components/Axes
* **X-axis:** "Score" (ranging from 0 to 1)
* **Y-axis:** "Proportion ≥ Score" (ranging from 0% to 100%)
* **Models (Top Row):** L3.2-1B, L3.2-3B, L3.2-3B-I, L3.1-8B
* **Categories (Left Column):** Syntax, Common Sense, Match
* **Legend:**
* Facilitation (Light Green)
* Irrelevance (Light Blue)
* Interference (Light Red)
### Detailed Analysis
The chart is structured as a grid of 12 individual line charts. Each chart shows the proportion of scores above a given threshold for each of the three phenomena (Facilitation, Irrelevance, Interference) for a specific model and category combination.
**Model L3.2-1B:**
* **Syntax:** Facilitation starts at approximately 95% and decreases to around 60% as the score increases to 1. Irrelevance starts at approximately 5% and increases to around 40% as the score increases to 1. Interference remains consistently low, around 0-10%.
* **Common Sense:** Facilitation starts at approximately 90% and decreases to around 50% as the score increases to 1. Irrelevance starts at approximately 10% and increases to around 50% as the score increases to 1. Interference remains consistently low, around 0-10%.
* **Match:** Facilitation starts at approximately 90% and decreases to around 40% as the score increases to 1. Irrelevance starts at approximately 10% and increases to around 60% as the score increases to 1. Interference remains consistently low, around 0-10%.
**Model L3.2-3B:**
* **Syntax:** Facilitation starts at approximately 95% and decreases to around 60% as the score increases to 1. Irrelevance starts at approximately 5% and increases to around 40% as the score increases to 1. Interference remains consistently low, around 0-10%.
* **Common Sense:** Facilitation starts at approximately 90% and decreases to around 50% as the score increases to 1. Irrelevance starts at approximately 10% and increases to around 50% as the score increases to 1. Interference remains consistently low, around 0-10%.
* **Match:** Facilitation starts at approximately 90% and decreases to around 40% as the score increases to 1. Irrelevance starts at approximately 10% and increases to around 60% as the score increases to 1. Interference remains consistently low, around 0-10%.
**Model L3.2-3B-I:**
* **Syntax:** Facilitation starts at approximately 95% and decreases to around 60% as the score increases to 1. Irrelevance starts at approximately 5% and increases to around 40% as the score increases to 1. Interference remains consistently low, around 0-10%.
* **Common Sense:** Facilitation starts at approximately 90% and decreases to around 50% as the score increases to 1. Irrelevance starts at approximately 10% and increases to around 50% as the score increases to 1. Interference remains consistently low, around 0-10%.
* **Match:** Facilitation starts at approximately 90% and decreases to around 40% as the score increases to 1. Irrelevance starts at approximately 10% and increases to around 60% as the score increases to 1. Interference remains consistently low, around 0-10%.
**Model L3.1-8B:**
* **Syntax:** Facilitation starts at approximately 95% and decreases to around 60% as the score increases to 1. Irrelevance starts at approximately 5% and increases to around 40% as the score increases to 1. Interference remains consistently low, around 0-10%.
* **Common Sense:** Facilitation starts at approximately 90% and decreases to around 50% as the score increases to 1. Irrelevance starts at approximately 10% and increases to around 50% as the score increases to 1. Interference remains consistently low, around 0-10%.
* **Match:** Facilitation starts at approximately 90% and decreases to around 40% as the score increases to 1. Irrelevance starts at approximately 10% and increases to around 60% as the score increases to 1. Interference remains consistently low, around 0-10%.
### Key Observations
* Facilitation consistently has the highest proportion of scores, especially at lower score values.
* Irrelevance generally increases as the score increases.
* Interference remains consistently low across all models and categories.
* The trends are remarkably similar across all four models and all three categories.
* There are no significant outliers or anomalies.
### Interpretation
The data suggests that, across all models and evaluation categories, the phenomenon of "Facilitation" is dominant, meaning that a large proportion of scores are high. As the score threshold increases, the proportion of "Facilitation" decreases while the proportion of "Irrelevance" increases. This indicates that as the required performance level rises, the model is more likely to produce irrelevant outputs. "Interference" is consistently minimal, suggesting that the model rarely produces outputs that actively hinder performance.
The consistency of these trends across different models (L3.2-1B, L3.2-3B, L3.2-3B-I, L3.1-8B) and evaluation categories (Syntax, Common Sense, Match) suggests a fundamental characteristic of these models' behavior. The models generally perform well, but their performance degrades as the required score increases, leading to more irrelevant outputs. The lack of significant differences between the models suggests that increasing model size (from 1B to 8B parameters) or using different training methods (as indicated by the "-I" suffix) does not substantially alter this overall trend. The consistent low level of interference suggests that the models are generally not actively harmful, but rather become less useful as the performance requirements increase.