TECHNICAL ASSET FINGERPRINT
0d2781765d0da69f96702920
Click to view fullscreen
Press ESC or click to close
FOUND IN PAPERS
EXPERT: healer-alpha-free VERSION 1
RUNTIME: free/openrouter/healer-alpha
INTEL_VERIFIED
## [Multi-Panel Line Chart]: Performance Proportion by Score Across Models and Domains
### Overview
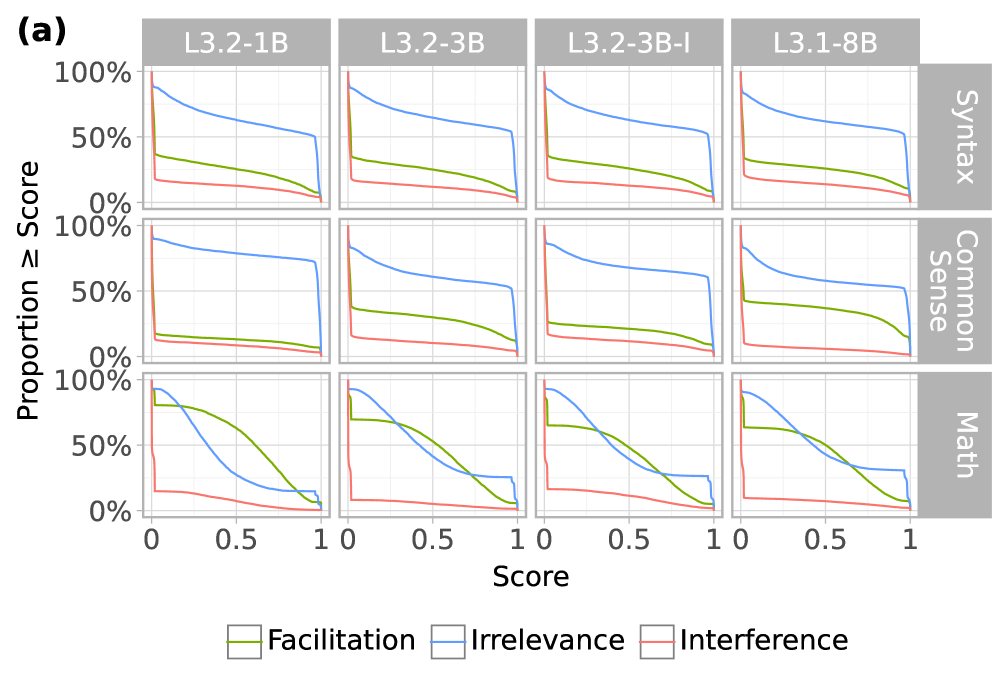
The image displays a 3x4 grid of line charts, labeled as panel (a). It visualizes the performance of four different language models across three cognitive domains. Each chart plots the "Proportion ≥ Score" (y-axis) against a normalized "Score" (x-axis, ranging from 0 to 1). The data is broken down by three experimental conditions, represented by colored lines.
### Components/Axes
* **Overall Grid Structure:**
* **Columns (Models):** Four columns, each headed by a model identifier in a gray box at the top: `L3.2-1B`, `L3.2-3B`, `L3.2-3B-I`, `L3.1-8B`.
* **Rows (Domains):** Three rows, each labeled on the right side in a vertical gray box: `Syntax` (top row), `Common Sense` (middle row), `Math` (bottom row).
* **Axes (for each subplot):**
* **Y-axis:** Labeled "Proportion ≥ Score" on the far left of the grid. Scale is marked at 0%, 50%, and 100%.
* **X-axis:** Labeled "Score" at the bottom center of the grid. Scale is marked at 0, 0.5, and 1.
* **Legend:** Positioned at the bottom center of the entire figure. It defines three colored lines:
* **Green line:** `Facilitation`
* **Blue line:** `Irrelevance`
* **Red line:** `Interference`
### Detailed Analysis
The following describes the trend for each line in each subplot. Values are approximate visual estimates.
**Row 1: Syntax**
* **L3.2-1B:** Blue (Irrelevance) starts near 100% at Score=0, declines steadily to ~50% at Score=1. Green (Facilitation) starts near 40%, declines to near 0%. Red (Interference) starts near 20%, declines to near 0%.
* **L3.2-3B:** Blue starts near 100%, declines to ~50%. Green starts near 35%, declines to near 0%. Red starts near 20%, declines to near 0%.
* **L3.2-3B-I:** Blue starts near 100%, declines to ~50%. Green starts near 35%, declines to near 0%. Red starts near 20%, declines to near 0%.
* **L3.1-8B:** Blue starts near 100%, declines to ~50%. Green starts near 35%, declines to near 0%. Red starts near 20%, declines to near 0%.
**Row 2: Common Sense**
* **L3.2-1B:** Blue starts near 100%, declines to ~70%. Green starts near 20%, declines to near 0%. Red starts near 15%, declines to near 0%.
* **L3.2-3B:** Blue starts near 100%, declines to ~50%. Green starts near 40%, declines to near 0%. Red starts near 20%, declines to near 0%.
* **L3.2-3B-I:** Blue starts near 100%, declines to ~60%. Green starts near 30%, declines to near 0%. Red starts near 15%, declines to near 0%.
* **L3.1-8B:** Blue starts near 100%, declines to ~50%. Green starts near 45%, declines to near 0%. Red starts near 15%, declines to near 0%.
**Row 3: Math**
* **L3.2-1B:** Blue starts near 100%, declines sharply to near 0% by Score=0.7. Green starts near 90%, declines to near 0% by Score=1. Red starts near 20%, declines to near 0%.
* **L3.2-3B:** Blue starts near 100%, declines to near 0% by Score=1. Green starts near 70%, declines to near 0% by Score=1. Red starts near 10%, declines to near 0%.
* **L3.2-3B-I:** Blue starts near 100%, declines to near 0% by Score=1. Green starts near 65%, declines to near 0% by Score=1. Red starts near 10%, declines to near 0%.
* **L3.1-8B:** Blue starts near 100%, declines to near 0% by Score=1. Green starts near 60%, declines to near 0% by Score=1. Red starts near 10%, declines to near 0%.
### Key Observations
1. **Consistent Hierarchy:** In nearly all charts, the blue line (Irrelevance) is the highest, followed by the green line (Facilitation), with the red line (Interference) consistently the lowest.
2. **Domain-Specific Behavior in Math:** The Math domain (bottom row) shows a distinctly different pattern. The blue (Irrelevance) and green (Facilitation) lines start much closer together and both decline more steeply toward zero as the score increases, compared to the Syntax and Common Sense domains.
3. **Model Similarity:** The four models (columns) show remarkably similar patterns within each domain row. The most notable difference is in the Math domain, where the starting point for the green line (Facilitation) appears slightly lower for the larger models (L3.2-3B, L3.2-3B-I, L3.1-8B) compared to L3.2-1B.
4. **Universal Low Interference:** The red line (Interference) is consistently low (starting below 20%) and flat across all models and domains, indicating this condition yields poor performance regardless of score threshold.
### Interpretation
This chart likely comes from a study on how different types of contextual information affect language model performance on various tasks. The "Proportion ≥ Score" metric suggests it's showing the cumulative distribution of scores—what fraction of test samples achieved at least a given score.
* **What the data suggests:** The results demonstrate a clear and consistent effect of context type. **Irrelevance** (blue) provides the best baseline performance, suggesting models perform best when given context that is not directly related but also not contradictory. **Facilitation** (green) provides a moderate boost over **Interference** (red), which severely hampers performance. This hierarchy holds across syntax and common sense tasks.
* **The Math Anomaly:** The dramatic convergence and steep decline of the Irrelevance and Facilitation lines in the Math domain indicate that for mathematical reasoning, the type of context matters less as the required score threshold increases. High-scoring math problems appear to be difficult for all models regardless of context, with performance dropping to near zero for scores above ~0.7-0.8.
* **Model Scaling:** The similarity across model sizes (from 1B to 8B parameters) suggests that this pattern of context sensitivity is a fundamental characteristic of the model architectures or training paradigms being tested, rather than an artifact of model scale. The slight differences in the Math domain may hint at subtle scaling effects for complex reasoning.
* **Underlying Mechanism:** The consistently poor performance under **Interference** implies that contradictory information is highly disruptive. The superiority of **Irrelevance** over **Facilitation** is intriguing; it may suggest that models are better at ignoring irrelevant information than they are at correctly utilizing subtly helpful information, or that the "Facilitation" context in this experiment introduced complexity that offset its benefits.
DECODING INTELLIGENCE...