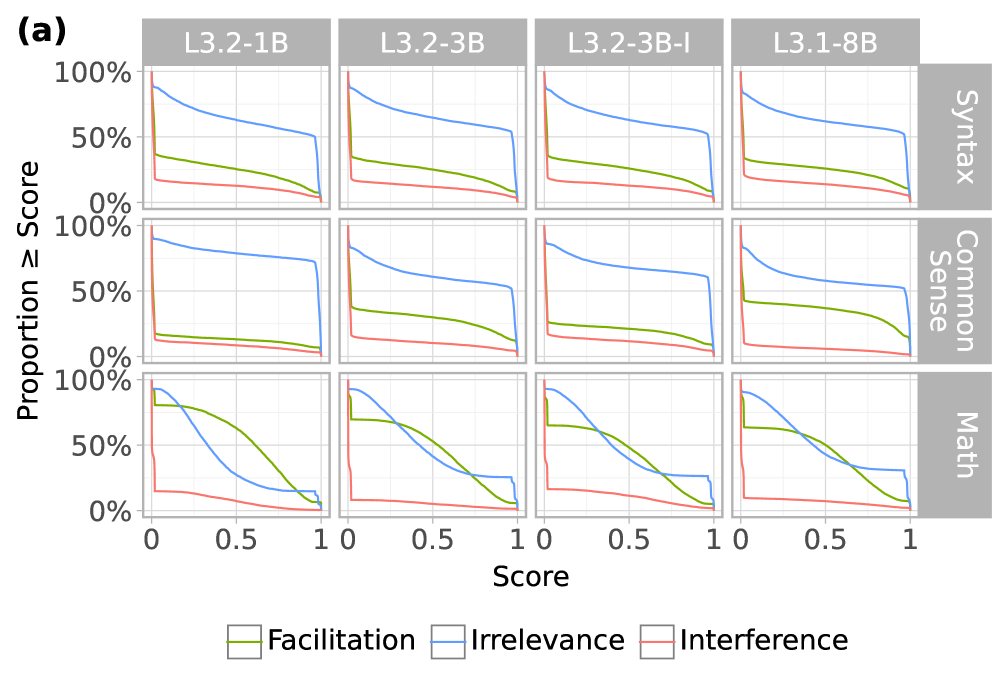
## Line Chart Grid: Model Performance Across Categories
### Overview
The image displays a 4x3 grid of line charts comparing three performance metrics (Facilitation, Irrelevance, Interference) across four model configurations (L3.2-1B, L3.2-3B, L3.2-3B-I, L3.1-8B) and three categories (Syntax, Common Sense, Math). Each chart shows how the proportion of instances meeting or exceeding a performance score threshold changes as the score threshold increases from 0 to 1.
### Components/Axes
- **X-axis**: Score (0 to 1 in 0.1 increments)
- **Y-axis**: Proportion ≥ Score (0% to 100% in 50% increments)
- **Legend**:
- Green: Facilitation
- Blue: Irrelevance
- Red: Interference
- **Chart Titles**: Model configurations (e.g., L3.2-1B)
- **Category Labels**: Right-side text indicating evaluation domain (Syntax, Common Sense, Math)
### Detailed Analysis
#### Model Configurations
1. **L3.2-1B**
- **Syntax**: Blue (Irrelevance) starts near 100% at Score 0, drops sharply to ~50% at Score 0.5, then plateaus. Green (Facilitation) starts ~40%, rises to ~60% at Score 0.2, then declines. Red (Interference) starts ~20%, peaks at ~30% at Score 0.3, then declines.
- **Common Sense**: Similar pattern to Syntax, with Irrelevance dropping faster.
- **Math**: Irrelevance drops more gradually, Facilitation shows a U-shaped curve.
2. **L3.2-3B**
- **Syntax**: Irrelevance drops from ~90% to ~40% by Score 0.5. Facilitation peaks at ~50% at Score 0.3.
- **Common Sense**: Irrelevance declines more gradually than Syntax.
- **Math**: Facilitation shows a steeper decline after Score 0.5.
3. **L3.2-3B-I**
- **Syntax**: Irrelevance drops sharply to ~30% at Score 0.5. Facilitation peaks earlier (~0.2) than L3.2-3B.
- **Common Sense**: Similar to Syntax but with less pronounced Facilitation peak.
- **Math**: Facilitation declines more steeply after Score 0.5.
4. **L3.1-8B**
- **Syntax**: Irrelevance drops from ~85% to ~45% at Score 0.5. Facilitation peaks at ~55% at Score 0.3.
- **Common Sense**: Irrelevance decline is more gradual than Syntax.
- **Math**: Facilitation shows a bimodal pattern with peaks at Scores 0.2 and 0.7.
### Key Observations
- **Irrelevance** consistently decreases with higher scores across all models and categories, suggesting improved performance at higher thresholds.
- **Facilitation** exhibits varied patterns: U-shaped curves in Math (L3.2-1B), bimodal in Math (L3.1-8B), and single peaks in Syntax/Common Sense.
- **Interference** shows minimal impact in most charts, with only slight fluctuations near Score 0.3-0.5.
- **Model Differences**: L3.2-3B-I shows more pronounced Facilitation peaks than L3.2-3B, while L3.1-8B demonstrates the most complex Math performance patterns.
### Interpretation
The data suggests that:
1. **Threshold Sensitivity**: All models show diminishing returns in performance as score thresholds increase, with Irrelevance being the most sensitive metric.
2. **Facilitation Variability**: The U-shaped and bimodal patterns in Math indicate potential trade-offs between different skill levels or task types.
3. **Model Architecture Impact**: The L3.2-3B-I variant's earlier Facilitation peak suggests architectural modifications (e.g., interference mitigation) may improve mid-range performance.
4. **Category-Specific Behavior**: Math performance shows more complex dynamics than Syntax/Common Sense, possibly reflecting different cognitive demands.
The charts highlight trade-offs between different performance dimensions and suggest that model configuration significantly impacts how these metrics interact across evaluation domains.