## Diagram: LLM Query Processing Flows
### Overview
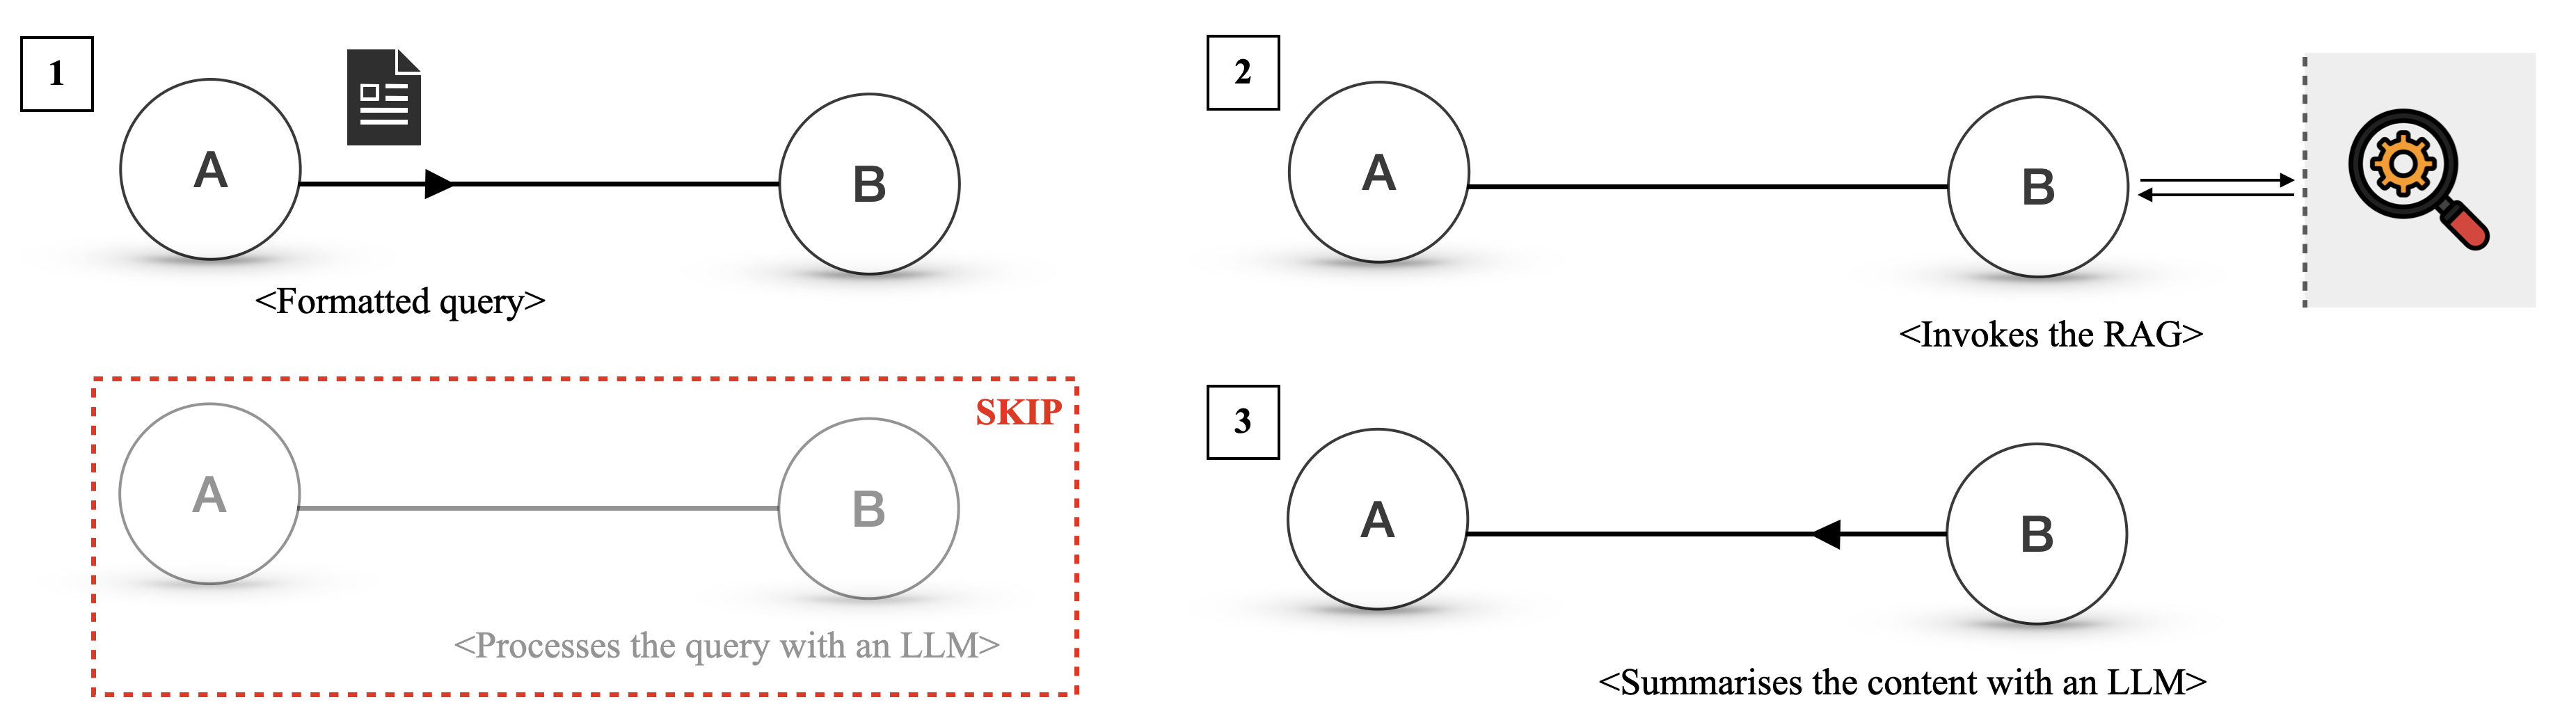
The image presents three distinct diagrams, each illustrating a different flow for processing queries using Large Language Models (LLMs). Each diagram features two nodes, labeled 'A' and 'B', connected by arrows indicating the direction of processing. The diagrams are numbered 1, 2, and 3 in the top-left corner of each flow.
### Components/Axes
* **Nodes:** Two nodes, labeled 'A' and 'B', represented as circles.
* **Arrows:** Arrows connecting the nodes, indicating the flow of information or processing.
* **Text Labels:** Descriptive text below each diagram explaining the process.
* **Icons:** An icon of a document in diagram 1, and a magnifying glass in diagram 2.
* **SKIP Label:** A "SKIP" label in red text in diagram 3.
### Detailed Analysis
**Diagram 1:**
* **Nodes:** Node A and Node B.
* **Arrow:** A solid black arrow points from Node A to Node B.
* **Icon:** A document icon is positioned to the right of Node A.
* **Text Label:** "<Formatted query>" is written below the arrow.
* **Flow:** Node A sends a formatted query to Node B.
**Diagram 2:**
* **Nodes:** Node A and Node B.
* **Arrow:** A solid black arrow points from Node A to Node B. A double-headed arrow connects Node B to an icon.
* **Icon:** A magnifying glass icon with a gear inside is positioned to the right of Node B, separated by a dashed vertical line.
* **Text Label:** "<Invokes the RAG>" is written below the arrow.
* **Flow:** Node A invokes the RAG (Retrieval-Augmented Generation) process on Node B.
**Diagram 3:**
* **Nodes:** Node A and Node B. Both nodes are gray.
* **Arrow:** A gray arrow points from Node A to Node B.
* **Text Label:** "<Processes the query with an LLM>" is written below the arrow.
* **SKIP Label:** The word "SKIP" is written in red above and to the right of Node B.
* **Red Dashed Border:** A red dashed border surrounds the entire diagram.
* **Flow:** This diagram represents a process that is skipped, where Node A processes the query with an LLM and sends it to Node B.
### Key Observations
* Diagram 1 shows a simple query formatting process.
* Diagram 2 illustrates the invocation of a RAG process.
* Diagram 3 represents a process that is skipped, possibly indicating an alternative or optional step.
### Interpretation
The diagrams illustrate different approaches to processing queries using LLMs. Diagram 1 represents a basic formatting step. Diagram 2 shows the use of Retrieval-Augmented Generation (RAG), a technique to improve LLM performance by retrieving relevant information. Diagram 3, marked as "SKIP," suggests a process that is bypassed, possibly due to specific conditions or configurations. The diagrams highlight the flexibility in designing LLM-based query processing pipelines. The "SKIP" diagram suggests a conditional execution path, where certain processing steps are omitted based on specific criteria.