## Bar Chart: Model Accuracy Comparison
### Overview
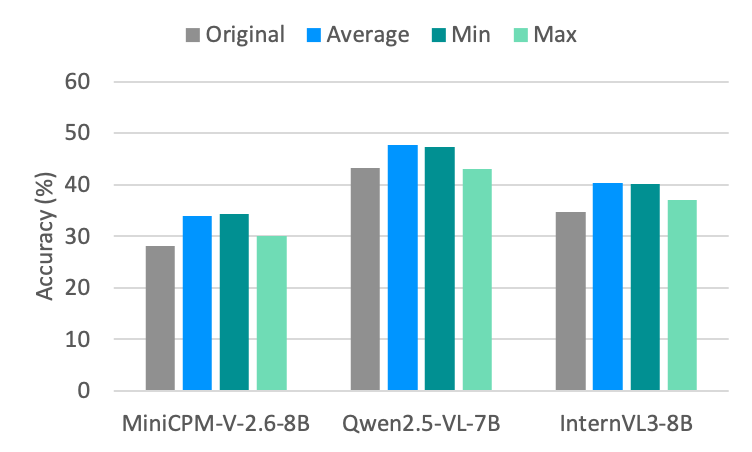
The image is a bar chart comparing the accuracy of three different models: MiniCPM-V-2.6-8B, Qwen2.5-VL-7B, and InternVL3-8B. For each model, the chart displays four different accuracy metrics: Original, Average, Min, and Max. The y-axis represents accuracy in percentage, ranging from 0% to 60%.
### Components/Axes
* **X-axis:** Model names: MiniCPM-V-2.6-8B, Qwen2.5-VL-7B, InternVL3-8B.
* **Y-axis:** Accuracy (%), with scale markers at 0, 10, 20, 30, 40, 50, and 60.
* **Legend:** Located at the top of the chart, indicating the color-coding for each accuracy metric:
* Original: Grey
* Average: Blue
* Min: Teal
* Max: Light Green
### Detailed Analysis
**MiniCPM-V-2.6-8B:**
* Original (Grey): Approximately 28%
* Average (Blue): Approximately 34%
* Min (Teal): Approximately 34%
* Max (Light Green): Approximately 30%
**Qwen2.5-VL-7B:**
* Original (Grey): Approximately 43%
* Average (Blue): Approximately 48%
* Min (Teal): Approximately 47%
* Max (Light Green): Approximately 43%
**InternVL3-8B:**
* Original (Grey): Approximately 35%
* Average (Blue): Approximately 40%
* Min (Teal): Approximately 40%
* Max (Light Green): Approximately 37%
### Key Observations
* Qwen2.5-VL-7B generally has the highest accuracy across all metrics compared to the other two models.
* For all models, the "Average" and "Min" accuracy values are very close to each other.
* The "Original" accuracy is consistently lower than the "Average" and "Min" accuracy for all models.
* The "Max" accuracy is lower than "Average" and "Min" for MiniCPM-V-2.6-8B and InternVL3-8B, but similar to "Original" for Qwen2.5-VL-7B.
### Interpretation
The bar chart provides a comparative analysis of the accuracy of three different models under different conditions (Original, Average, Min, Max). The data suggests that Qwen2.5-VL-7B performs better overall in terms of accuracy compared to MiniCPM-V-2.6-8B and InternVL3-8B. The differences between "Average," "Min," and "Max" accuracy might indicate the variability in the model's performance under different test conditions or datasets. The "Original" accuracy likely represents the baseline performance without any specific optimizations or averaging. The proximity of "Average" and "Min" suggests a consistent lower bound on performance, while "Max" indicates the potential peak performance.