\n
## Bar Chart: Accuracy Comparison of Language Models
### Overview
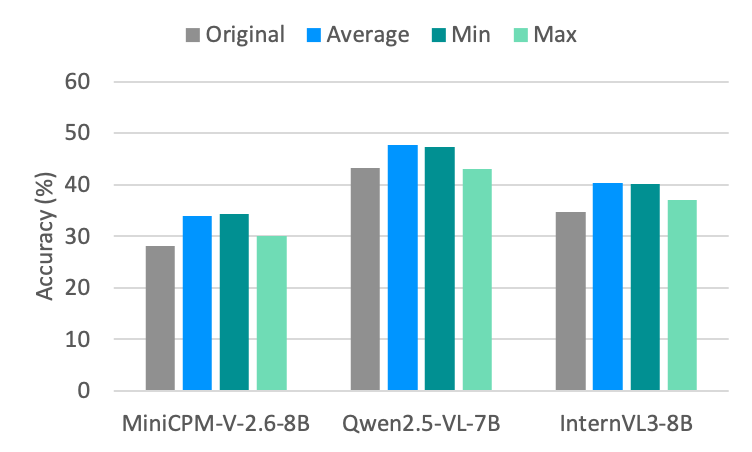
This bar chart compares the accuracy of three language models – MiniCPM-V-2.6-8B, Qwen2.5-VL-7B, and InternVL3-8B – based on four metrics: Original, Average, Minimum, and Maximum accuracy. The accuracy is measured in percentage (%).
### Components/Axes
* **X-axis:** Represents the language models: MiniCPM-V-2.6-8B, Qwen2.5-VL-7B, and InternVL3-8B.
* **Y-axis:** Represents the Accuracy (%), ranging from 0 to 60, with tick marks at intervals of 10.
* **Legend:** Located at the top-left corner, defines the color-coding for each metric:
* Original (Grey)
* Average (Blue)
* Min (Teal)
* Max (Green)
### Detailed Analysis
The chart consists of three groups of four bars, one group for each language model. Within each group, each bar represents one of the four accuracy metrics.
**MiniCPM-V-2.6-8B:**
* Original: Approximately 29%
* Average: Approximately 33%
* Min: Approximately 32%
* Max: Approximately 35%
**Qwen2.5-VL-7B:**
* Original: Approximately 43%
* Average: Approximately 48%
* Min: Approximately 45%
* Max: Approximately 49%
**InternVL3-8B:**
* Original: Approximately 36%
* Average: Approximately 41%
* Min: Approximately 40%
* Max: Approximately 43%
### Key Observations
* Qwen2.5-VL-7B consistently demonstrates the highest accuracy across all metrics.
* The difference between the minimum and maximum accuracy is relatively small for all models, suggesting a stable performance.
* The "Average" accuracy is consistently higher than the "Original" accuracy for each model.
* MiniCPM-V-2.6-8B exhibits the lowest accuracy across all metrics.
### Interpretation
The data suggests that Qwen2.5-VL-7B is the most accurate language model among the three tested, based on the metrics provided. The consistent difference between "Original" and "Average" accuracy might indicate that the model's performance varies depending on the input data, with the average representing a more robust measure. The small gap between "Min" and "Max" suggests that the model's performance is relatively consistent across different scenarios. The lower accuracy of MiniCPM-V-2.6-8B could be due to its architecture, training data, or other factors. This chart provides a comparative performance overview, but further investigation would be needed to understand the underlying reasons for these differences. The metrics used (Original, Average, Min, Max) are not explicitly defined, so the precise meaning of each metric is unclear without additional context.