# Technical Document Analysis of Accuracy Comparison Chart
## Language Declaration
- **Primary Language**: English
- **Secondary Languages**: None detected
---
## Chart Structure and Components
### Header
- **Title**: Not explicitly labeled (implied by context)
- **Legend**: Located in the **top-right corner**
- **Labels**:
- `Original` (gray)
- `Average` (blue)
- `Min` (dark teal)
- `Max` (light teal)
### Main Chart
- **Type**: Grouped bar chart
- **X-Axis**:
- **Labels**:
- `MiniCPM-V-2.6-8B`
- `Qwen2.5-VL-7B`
- `InternVL3-8B`
- **Position**: Bottom of chart
- **Y-Axis**:
- **Title**: `Accuracy (%)`
- **Range**: 0% to 60% (increments of 10%)
- **Position**: Left side of chart
### Data Points and Trends
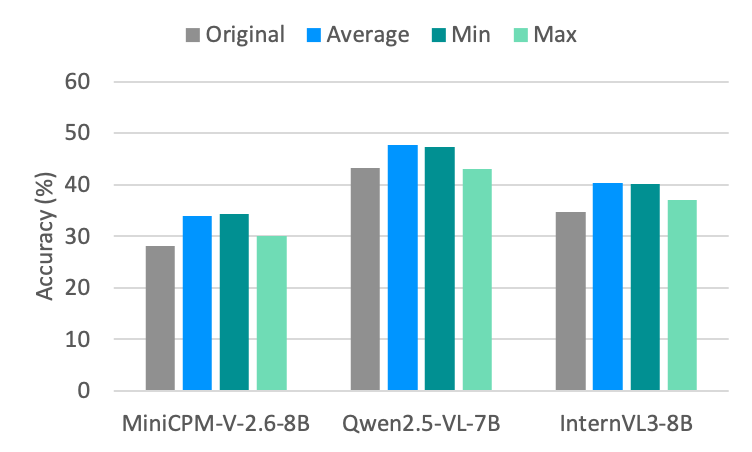
#### 1. **MiniCPM-V-2.6-8B**
- **Original**: ~28% (gray bar)
- **Average**: ~34% (blue bar)
- **Min**: ~35% (dark teal bar)
- **Max**: ~30% (light teal bar)
- **Trend**:
- Average > Min > Original > Max
#### 2. **Qwen2.5-VL-7B**
- **Original**: ~43% (gray bar)
- **Average**: ~48% (blue bar)
- **Min**: ~47% (dark teal bar)
- **Max**: ~43% (light teal bar)
- **Trend**:
- Average > Min > Original = Max
#### 3. **InternVL3-8B**
- **Original**: ~35% (gray bar)
- **Average**: ~40% (blue bar)
- **Min**: ~40% (dark teal bar)
- **Max**: ~37% (light teal bar)
- **Trend**:
- Average = Min > Original > Max
---
## Data Table Reconstruction
| Model | Original (%) | Average (%) | Min (%) | Max (%) |
|---------------------|--------------|-------------|---------|---------|
| MiniCPM-V-2.6-8B | 28 | 34 | 35 | 30 |
| Qwen2.5-VL-7B | 43 | 48 | 47 | 43 |
| InternVL3-8B | 35 | 40 | 40 | 37 |
---
## Spatial Grounding
- **Legend**: Top-right corner (aligned with chart title area)
- **X-Axis Labels**: Centered below each group of bars
- **Y-Axis Labels**: Left-aligned, vertical ticks at 0%, 10%, ..., 60%
---
## Component Isolation
1. **Header**: Legend and implied title
2. **Main Chart**: Three grouped bars per model, with distinct colors for metrics
3. **Footer**: Y-axis percentage labels and gridlines
---
## Key Observations
1. **Accuracy Trends**:
- `Average` consistently outperforms `Original` across all models.
- `Min` and `Max` metrics show variability:
- `Min` often matches or exceeds `Average` (e.g., Qwen2.5-VL-7B).
- `Max` frequently underperforms `Original` (e.g., MiniCPM-V-2.6-8B).
2. **Model Performance**:
- `Qwen2.5-VL-7B` achieves the highest `Average` accuracy (~48%).
- `MiniCPM-V-2.6-8B` has the lowest `Original` accuracy (~28%).
---
## Validation Checks
- **Color Consistency**:
- All `Original` bars are gray.
- `Average` bars are blue.
- `Min` bars are dark teal.
- `Max` bars are light teal.
- **Trend Verification**:
- Numerical values align with visual bar heights (e.g., Qwen2.5-VL-7B’s `Average` bar is the tallest).
---
## Conclusion
The chart compares accuracy metrics (`Original`, `Average`, `Min`, `Max`) across three language models. `Qwen2.5-VL-7B` demonstrates the highest overall performance, while `MiniCPM-V-2.6-8B` lags in `Original` accuracy. The `Average` metric consistently outperforms `Original`, suggesting potential for optimization in model configurations.