TECHNICAL ASSET FINGERPRINT
0d9c9cff55250efac606a614
Click to view fullscreen
Press ESC or click to close
FOUND IN PAPERS
EXPERT: gemini-2.5-flash-lite-free VERSION 1
RUNTIME: google-free/gemini-2.5-flash-lite
INTEL_VERIFIED
## Line Charts: Agent Performance Metrics Over Rounds
### Overview
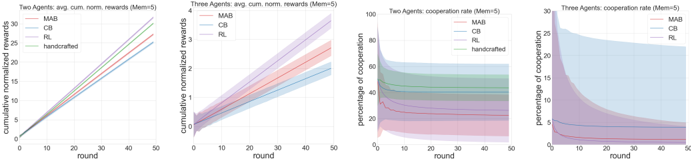
This image contains four line charts, arranged in a 2x2 grid. The charts display performance metrics for different agent strategies (MAB, CB, RL, and handcrafted) across a number of rounds. The top row shows cumulative normalized rewards for "Two Agents" and "Three Agents," while the bottom row shows the percentage of cooperation for "Two Agents" and "Three Agents." All charts assume a memory parameter (Mem) of 5. Shaded areas around the lines represent uncertainty or variance.
### Components/Axes
**Chart 1 (Top-Left): Two Agents: avg. cum. norm. rewards (Mem=5)**
* **Title:** Two Agents: avg. cum. norm. rewards (Mem=5)
* **Y-axis Title:** cumulative normalized rewards
* **Y-axis Scale:** 0 to 30, with major ticks at 0, 5, 10, 15, 20, 25, 30.
* **X-axis Title:** round
* **X-axis Scale:** 0 to 50, with major ticks at 0, 10, 20, 30, 40, 50.
* **Legend:** Located in the top-left corner.
* MAB (Red line)
* CB (Blue line)
* RL (Gray line)
* handcrafted (Green line)
**Chart 2 (Top-Right): Three Agents: avg. cum. norm. rewards (Mem=5)**
* **Title:** Three Agents: avg. cum. norm. rewards (Mem=5)
* **Y-axis Title:** cumulative normalized rewards
* **Y-axis Scale:** 0 to 4, with major ticks at 0, 1, 2, 3, 4.
* **X-axis Title:** round
* **X-axis Scale:** 0 to 50, with major ticks at 0, 10, 20, 30, 40, 50.
* **Legend:** Located in the top-left corner.
* MAB (Red line)
* CB (Blue line)
* RL (Purple line)
**Chart 3 (Bottom-Left): Two Agents: cooperation rate (Mem=5)**
* **Title:** Two Agents: cooperation rate (Mem=5)
* **Y-axis Title:** percentage of cooperation
* **Y-axis Scale:** 0 to 100, with major ticks at 0, 20, 40, 60, 80, 100.
* **X-axis Title:** round
* **X-axis Scale:** 0 to 50, with major ticks at 0, 10, 20, 30, 40, 50.
* **Legend:** Located in the top-left corner.
* MAB (Red line)
* CB (Blue line)
* RL (Purple line)
* handcrafted (Green line)
**Chart 4 (Bottom-Right): Three Agents: cooperation rate (Mem=5)**
* **Title:** Three Agents: cooperation rate (Mem=5)
* **Y-axis Title:** percentage of cooperation
* **Y-axis Scale:** 0 to 30, with major ticks at 0, 5, 10, 15, 20, 25, 30.
* **X-axis Title:** round
* **X-axis Scale:** 0 to 50, with major ticks at 0, 10, 20, 30, 40, 50.
* **Legend:** Located in the top-right corner.
* MAB (Red line)
* CB (Blue line)
* RL (Purple line)
### Detailed Analysis
**Chart 1: Two Agents: avg. cum. norm. rewards (Mem=5)**
* **Trend:** All lines show a consistent upward linear trend, indicating increasing cumulative rewards over rounds.
* **Data Points (approximate at round 50):**
* MAB (Red): ~27
* CB (Blue): ~25
* RL (Gray): ~32
* handcrafted (Green): ~31
* **Uncertainty:** Shaded areas are relatively narrow, suggesting low variance.
**Chart 2: Three Agents: avg. cum. norm. rewards (Mem=5)**
* **Trend:** All lines show an upward trend, but with a noticeable decrease in the rate of increase compared to Chart 1. The shaded areas are wider, indicating higher variance.
* **Data Points (approximate at round 50):**
* MAB (Red): ~2.2
* CB (Blue): ~1.7
* RL (Purple): ~2.5
* **Uncertainty:** The shaded areas are significantly wider than in Chart 1, especially for MAB and RL.
**Chart 3: Two Agents: cooperation rate (Mem=5)**
* **Trend:** All lines show a rapid decrease in cooperation rate from round 0, stabilizing at a lower level by around round 10-20.
* **Data Points (approximate at round 50):**
* MAB (Red): ~25%
* CB (Blue): ~40%
* RL (Purple): ~35%
* handcrafted (Green): ~60%
* **Uncertainty:** Shaded areas are moderately wide, particularly at the beginning of the rounds. The handcrafted strategy shows the highest and most stable cooperation rate.
**Chart 4: Three Agents: cooperation rate (Mem=5)**
* **Trend:** All lines show a rapid decrease in cooperation rate from round 0, stabilizing at a very low level by around round 10-20. The shaded areas are very wide, indicating high variance.
* **Data Points (approximate at round 50):**
* MAB (Red): ~2%
* CB (Blue): ~4%
* RL (Purple): ~5%
* **Uncertainty:** The shaded areas are extremely wide, covering a large portion of the y-axis range, especially for MAB and CB. The cooperation rates are significantly lower than in the "Two Agents" scenario.
### Key Observations
* **Agent Performance:** In the "Two Agents" scenario, the RL and handcrafted strategies achieve the highest cumulative normalized rewards, while MAB and CB are slightly lower. In the "Three Agents" scenario, RL achieves the highest cumulative rewards, followed by MAB, and then CB.
* **Cooperation Dynamics:** The "Two Agents" scenario shows significantly higher cooperation rates across all strategies compared to the "Three Agents" scenario. The handcrafted strategy consistently exhibits the highest cooperation rate in the "Two Agents" setting.
* **Impact of Agent Count:** Increasing the number of agents from two to three drastically reduces the cooperation rate and increases the variance in performance metrics, particularly for cumulative rewards.
* **Variance:** The "Three Agents" charts exhibit considerably higher variance (wider shaded areas) than the "Two Agents" charts, suggesting less predictable outcomes or more diverse agent behaviors when more agents are involved.
### Interpretation
The data suggests that the number of agents significantly impacts both performance (cumulative rewards) and cooperative behavior. In a two-agent system, strategies like RL and handcrafted approaches can achieve high cumulative rewards and maintain relatively high cooperation rates. The handcrafted strategy appears to be the most cooperative.
However, when the number of agents increases to three, the environment becomes more challenging for cooperation. All strategies see a sharp decline in cooperation rates, and the variance in cumulative rewards increases substantially. This indicates that coordinating and achieving consistent positive outcomes becomes more difficult with more agents. The RL strategy, while performing best in terms of cumulative rewards in the three-agent scenario, still operates at a very low cooperation rate, suggesting it might be achieving its rewards through non-cooperative means or a highly optimized, albeit low-cooperation, strategy. The wide variance in the three-agent scenarios implies that the outcomes are less stable and potentially more sensitive to initial conditions or specific agent interactions. The memory parameter (Mem=5) seems to be a constant factor across all plots, implying that this specific memory configuration is being tested.
DECODING INTELLIGENCE...