\n
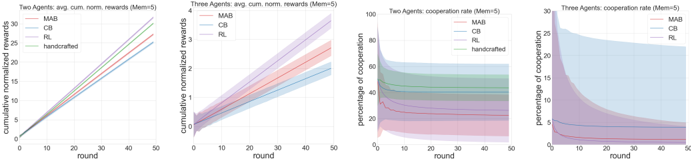
## Line Charts: Cumulative Rewards and Cooperation Rates
### Overview
The image presents four line charts visualizing the performance of different algorithms (MAB, CB, RL, handcrafted) in two and three-agent scenarios. The first two charts display cumulative normalized rewards over rounds, while the latter two show the percentage of cooperation over rounds. Each chart includes shaded areas representing confidence intervals.
### Components/Axes
All four charts share the following characteristics:
* **X-axis:** "round" ranging from 0 to 50.
* **Y-axis:** Varies depending on the chart.
* **Algorithms (Lines/Shaded Areas):** MAB (Multi-Armed Bandit), CB (presumably Contextual Bandit), RL (Reinforcement Learning), and "handcrafted".
* **Legend:** Located at the top-right of each chart, indicating the color corresponding to each algorithm.
* **Mem(5):** This appears to be a parameter or condition for the experiment, indicated in the chart titles.
Specifically:
* **Chart 1:** "Two Agents avg cum norm rewards (Mem(5))" - Y-axis: "Cumulative normalized rewards".
* **Chart 2:** "Three Agents avg cum norm rewards (Mem(5))" - Y-axis: "Cumulative normalized rewards".
* **Chart 3:** "Two Agents cooperation rate (Mem(5))" - Y-axis: "Percentage of cooperation".
* **Chart 4:** "Three Agents cooperation rate (Mem(5))" - Y-axis: "Percentage of cooperation".
### Detailed Analysis or Content Details
**Chart 1: Two Agents Cumulative Normalized Rewards**
* **MAB (Green):** The line starts at approximately 0 at round 0 and increases steadily, reaching around 3.5 at round 50.
* **CB (Orange):** The line starts at approximately 0 at round 0 and increases steadily, reaching around 3.0 at round 50.
* **RL (Pink):** The line starts at approximately 0 at round 0 and increases steadily, reaching around 2.5 at round 50.
* **handcrafted (Light Green):** The line starts at approximately 0 at round 0 and increases steadily, reaching around 3.2 at round 50.
* The shaded areas indicate confidence intervals around each line. MAB has the widest confidence interval, while RL has the narrowest.
**Chart 2: Three Agents Cumulative Normalized Rewards**
* **MAB (Green):** The line starts at approximately 0 at round 0 and increases steadily, reaching around 4.0 at round 50.
* **CB (Orange):** The line starts at approximately 0 at round 0 and increases steadily, reaching around 3.5 at round 50.
* **RL (Pink):** The line starts at approximately 0 at round 0 and increases steadily, reaching around 3.0 at round 50.
* The shaded areas indicate confidence intervals around each line. MAB has the widest confidence interval, while RL has the narrowest.
**Chart 3: Two Agents Cooperation Rate**
* **MAB (Green):** The line starts at approximately 80% at round 0 and decreases steadily, reaching around 20% at round 50.
* **CB (Orange):** The line starts at approximately 80% at round 0 and decreases steadily, reaching around 30% at round 50.
* **RL (Pink):** The line starts at approximately 80% at round 0 and decreases steadily, reaching around 10% at round 50.
* **handcrafted (Light Green):** The line starts at approximately 80% at round 0 and decreases steadily, reaching around 40% at round 50.
* The shaded areas indicate confidence intervals around each line.
**Chart 4: Three Agents Cooperation Rate**
* **MAB (Green):** The line starts at approximately 90% at round 0 and decreases steadily, reaching around 20% at round 50.
* **CB (Orange):** The line starts at approximately 90% at round 0 and decreases steadily, reaching around 30% at round 50.
* **RL (Pink):** The line starts at approximately 90% at round 0 and decreases steadily, reaching around 10% at round 50.
* The shaded areas indicate confidence intervals around each line.
### Key Observations
* **Rewards:** MAB consistently achieves the highest cumulative normalized rewards in both two and three-agent scenarios.
* **Cooperation:** All algorithms exhibit a decrease in cooperation rate over rounds. RL consistently shows the lowest cooperation rate in both scenarios.
* **Confidence Intervals:** MAB generally has wider confidence intervals, suggesting more variability in its performance.
* **Trade-off:** There appears to be a trade-off between reward and cooperation. Algorithms with higher rewards (MAB) tend to have lower cooperation rates.
### Interpretation
The data suggests that MAB is the most effective algorithm for maximizing cumulative rewards in both two and three-agent settings, given the parameter Mem(5). However, this comes at the cost of reduced cooperation among agents. RL, while achieving lower rewards, maintains a slightly higher level of cooperation compared to MAB. The decreasing cooperation rates across all algorithms indicate a potential challenge in sustaining collaborative behavior over extended interactions. The confidence intervals provide insight into the reliability of each algorithm's performance. The wider intervals for MAB suggest that its performance is more sensitive to variations in the environment or initial conditions. The parameter Mem(5) likely influences the memory or learning capacity of the agents, and its value may be a key factor in the observed performance differences. Further investigation is needed to understand the underlying mechanisms driving these trends and to explore strategies for improving both reward and cooperation in multi-agent systems.