## Map Visualization: Waypoint Navigation Layout
### Overview
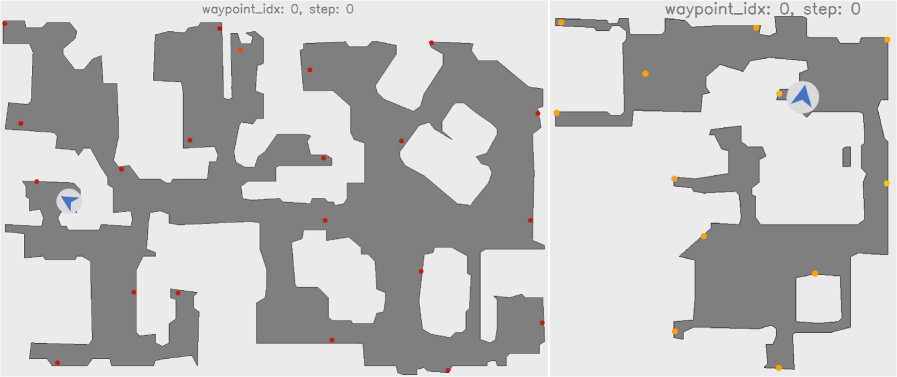
The image displays two side-by-side grayscale maps with annotated waypoints. Both maps are labeled "waypoint_idx: 0, step: 0" at the top. The left map contains numerous red dots, while the right map features yellow dots and a blue compass icon. White spaces represent open areas, and gray regions denote obstacles or walls.
### Components/Axes
- **Maps**:
- **Left Map**: Dominated by red dots (14 total) scattered across the layout.
- **Right Map**: Contains 8 yellow dots and a central blue compass icon.
- **Labels**:
- Top text: "waypoint_idx: 0, step: 0" (identical for both maps).
- **Compass Icon**:
- Blue arrow symbolizing direction, positioned at the bottom-left of the left map and centered in the right map.
### Detailed Analysis
- **Waypoint Distribution**:
- Left map: Red dots are densely clustered in the lower-left quadrant and along the central vertical axis.
- Right map: Yellow dots are spaced more evenly, with concentrations in the upper-right and lower-left regions.
- **Compass Placement**:
- Left map: Compass is anchored at the bottom-left corner, suggesting a starting orientation.
- Right map: Compass is centered, implying a mid-navigation reference point.
- **Color Coding**:
- Red dots (left map) and yellow dots (right map) likely represent distinct waypoint categories (e.g., "initial" vs. "target" points).
### Key Observations
1. **Waypoint Density**: The left map has nearly double the number of red dots compared to yellow dots on the right map.
2. **Compass Orientation**: The compass direction (pointing northeast) remains consistent across both maps, despite differing positions.
3. **Spatial Symmetry**: Both maps share a mirrored layout, with open areas (white spaces) forming a central corridor.
### Interpretation
The maps likely represent stages of a navigation task:
- **Left Map**: Initial waypoint setup (red dots) with a fixed starting orientation (compass at bottom-left).
- **Right Map**: Progressed navigation (yellow dots) with a dynamic reference point (centered compass).
- **White Spaces**: Open pathways suggest traversable routes, while gray regions act as barriers.
- **Waypoint Index/Step**: The label "waypoint_idx: 0, step: 0" implies these are baseline configurations, possibly for algorithm initialization or step-0 state visualization.
No numerical data or explicit trends are present, but the spatial arrangement suggests a progression from static waypoint definition (left) to dynamic pathfinding (right). The compass’s repositioning may indicate recalibration during navigation.