# Technical Document Extraction: Probability Distribution Chart
## 1. Image Overview
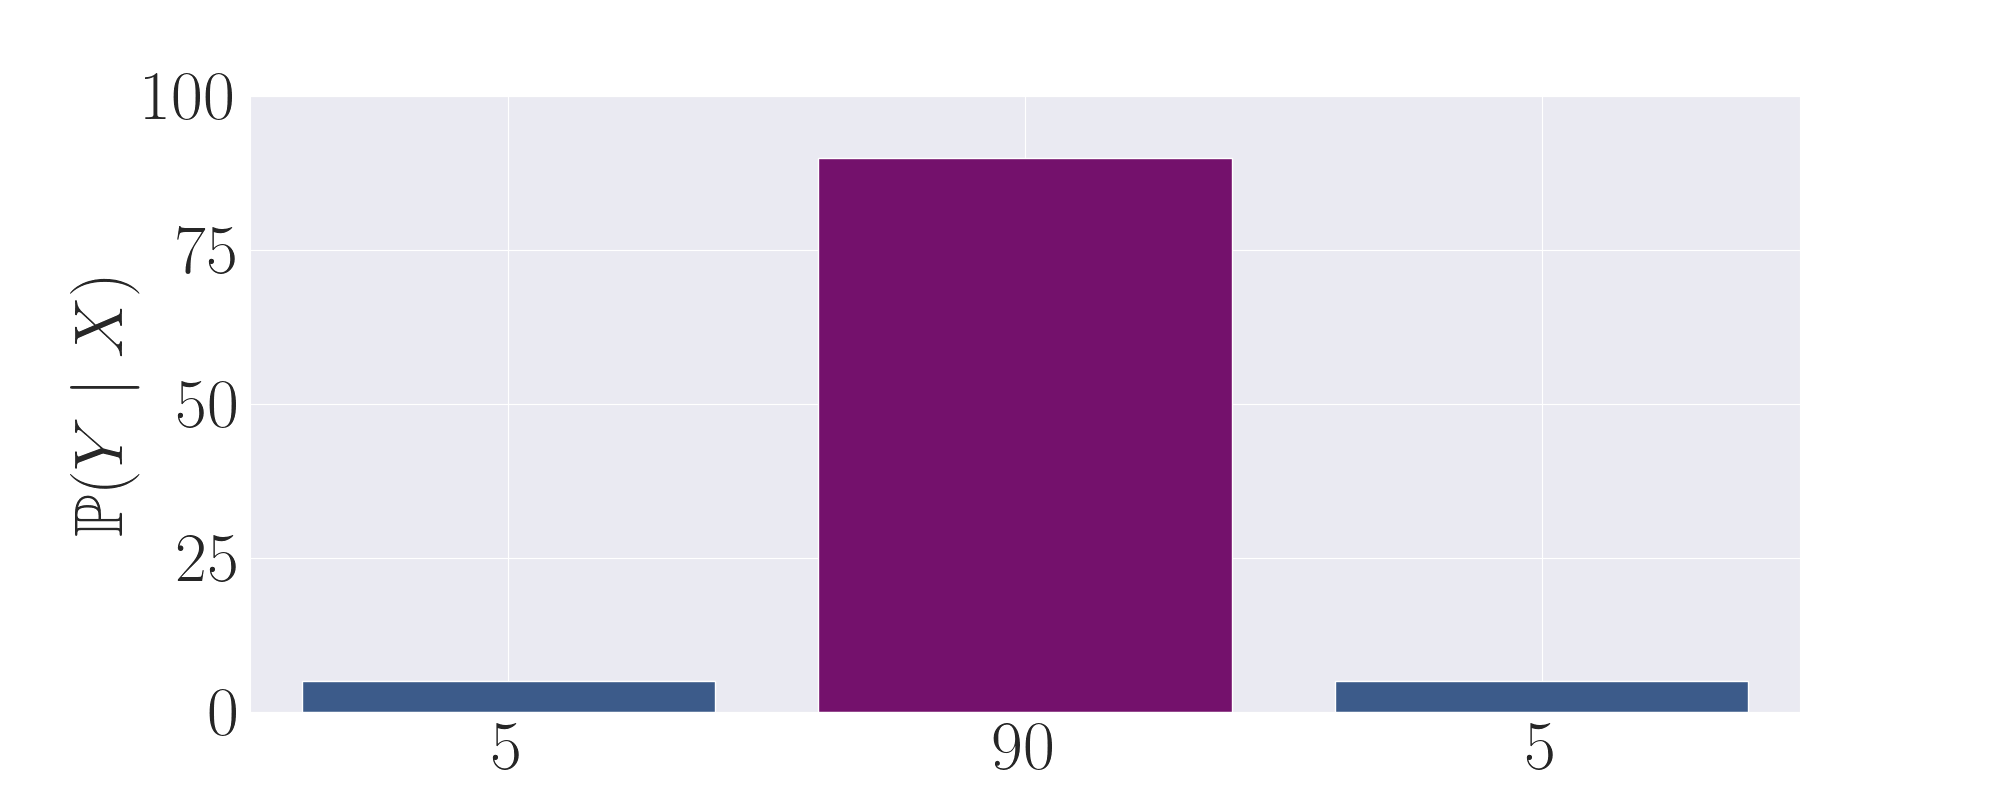
This image is a bar chart representing a conditional probability distribution. It features three distinct bars against a light gray grid background. The chart uses color coding to differentiate between high and low probability values.
## 2. Component Isolation
### Header/Title
* No explicit title text is present in the image.
### Main Chart Area (Data Visualization)
* **Type:** Vertical Bar Chart.
* **Y-Axis (Vertical):**
* **Label:** $\mathbb{P}(Y \mid X)$ (Mathematical notation for the conditional probability of $Y$ given $X$).
* **Scale Markers:** 0, 25, 50, 75, 100.
* **X-Axis (Horizontal):**
* **Categories/Labels:** "5", "90", "5".
* **Grid:** Horizontal white grid lines are placed at the 25, 50, 75, and 100 markers.
### Footer/Legend
* There is no separate legend box. The data values are labeled directly beneath each bar on the x-axis.
## 3. Data Extraction and Trend Verification
### Trend Analysis
The chart shows a highly peaked distribution (leptokurtic). The central category holds the vast majority of the probability mass, while the two flanking categories represent minor, equal portions of the distribution.
### Data Table Reconstruction
Based on the visual alignment with the y-axis markers and the labels provided on the x-axis:
| X-Axis Category (Label) | Color | Estimated Y-Value ($\mathbb{P}(Y \mid X)$) |
| :--- | :--- | :--- |
| 5 | Dark Blue | 5 |
| 90 | Deep Purple/Magenta | 90 |
| 5 | Dark Blue | 5 |
### Spatial Grounding & Logic Check
* **Left Bar:** Labeled "5". The color is dark blue. Visually, the top of the bar sits significantly below the "25" grid line, consistent with a value of 5.
* **Center Bar:** Labeled "90". The color is deep purple. Visually, the top of the bar sits exactly halfway between the "75" and "100" grid lines (which would be 87.5), but slightly higher, confirming the "90" label.
* **Right Bar:** Labeled "5". The color is dark blue. Visually identical in height to the first bar, confirming the value of 5.
* **Summation Check:** $5 + 90 + 5 = 100$. This confirms the chart represents a full probability distribution where the total sum equals 100%.
## 4. Textual Transcription
* **Y-Axis Label:** `P(Y | X)` (rendered in LaTeX style as `\mathbb{P}(Y \mid X)`)
* **Y-Axis Markers:** `0`, `25`, `50`, `75`, `100`
* **X-Axis Labels:** `5`, `90`, `5`