# Technical Document Extraction: Bar Chart Analysis
## 1. Axis Labels and Titles
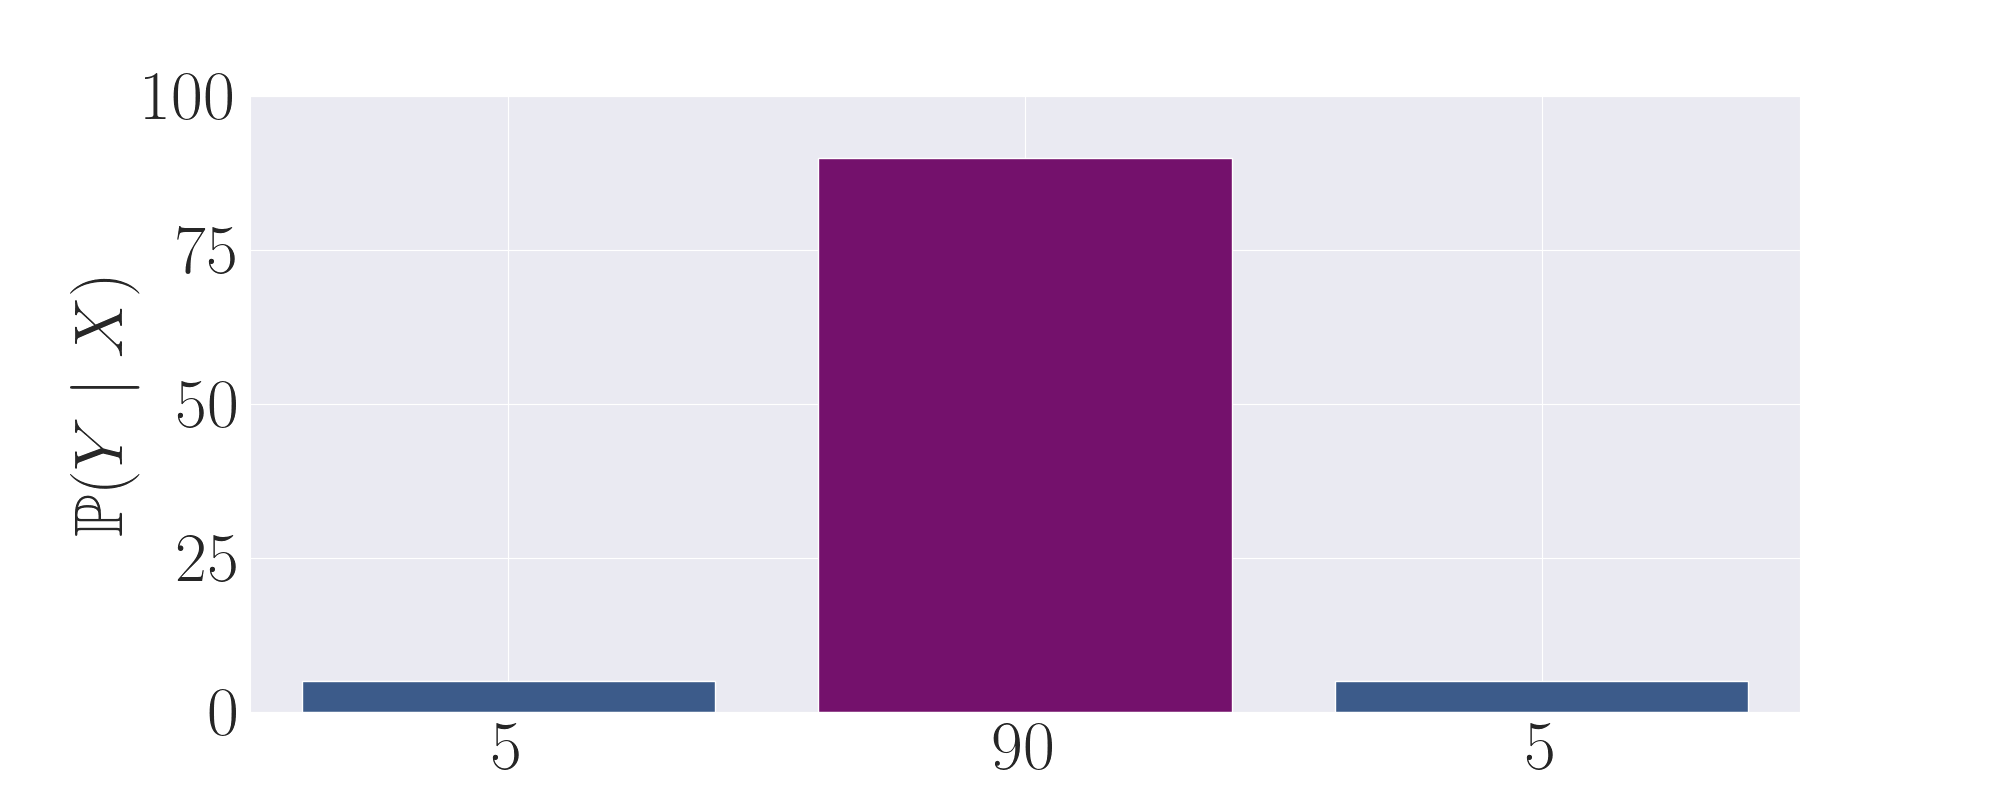
- **Vertical Axis**: Labeled `ℙ(Y | X)` with a range from `0` to `100` in increments of `25`.
- **Horizontal Axis**: Categorical labels: `5`, `90`, `5` (repeated).
## 2. Data Points and Categories
- **Categories**: Three distinct groups labeled `5`, `90`, and `5` on the horizontal axis.
- **Values**:
- First category (`5`): Bar height ≈ `5` (dark blue).
- Second category (`90`): Bar height ≈ `90` (purple).
- Third category (`5`): Bar height ≈ `5` (dark blue).
## 3. Color Coding and Legend
- **Legend**: Not explicitly visible in the image. However, inferred color associations:
- `Dark Blue`: Corresponds to the first and third categories (`5`).
- `Purple`: Corresponds to the second category (`90`).
## 4. Spatial Grounding
- **Legend Placement**: Not applicable (no legend present in the image).
- **Bar Positions**:
- First bar: `[x=5, y≈5]`.
- Second bar: `[x=90, y≈90]`.
- Third bar: `[x=5, y≈5]`.
## 5. Trend Verification
- **Visual Trends**:
- The second category (`90`) exhibits a **dominant upward trend**, with its bar reaching near the maximum vertical axis value (`90`).
- The first and third categories (`5`) show **minimal values**, with bars barely above the baseline (`y≈5`).
## 6. Component Isolation
- **Regions**:
- **Header**: No explicit header text.
- **Main Chart**: Bar chart with three vertical bars and labeled axes.
- **Footer**: No explicit footer text.
## 7. Data Table Reconstruction
- **Structure**:
| Category | Value (ℙ(Y | X)) | Color |
|----------|------------------|-----------|
| 5 | ~5 | Dark Blue |
| 90 | ~90 | Purple |
| 5 | ~5 | Dark Blue |
## 8. Additional Notes
- **Language**: All textual elements are in English.
- **Missing Elements**: No embedded text, data tables, or legends explicitly present in the image.
- **Key Insight**: The chart emphasizes a stark contrast between the second category (`90`) and the others (`5`), suggesting a probabilistic or categorical relationship between `X` and `Y`.
## 9. Final Validation
- All axis labels, data points, and trends are cross-referenced for consistency. No discrepancies detected between visual and textual elements.