## Decision Tree: Bakery Loaf Calculation
### Overview
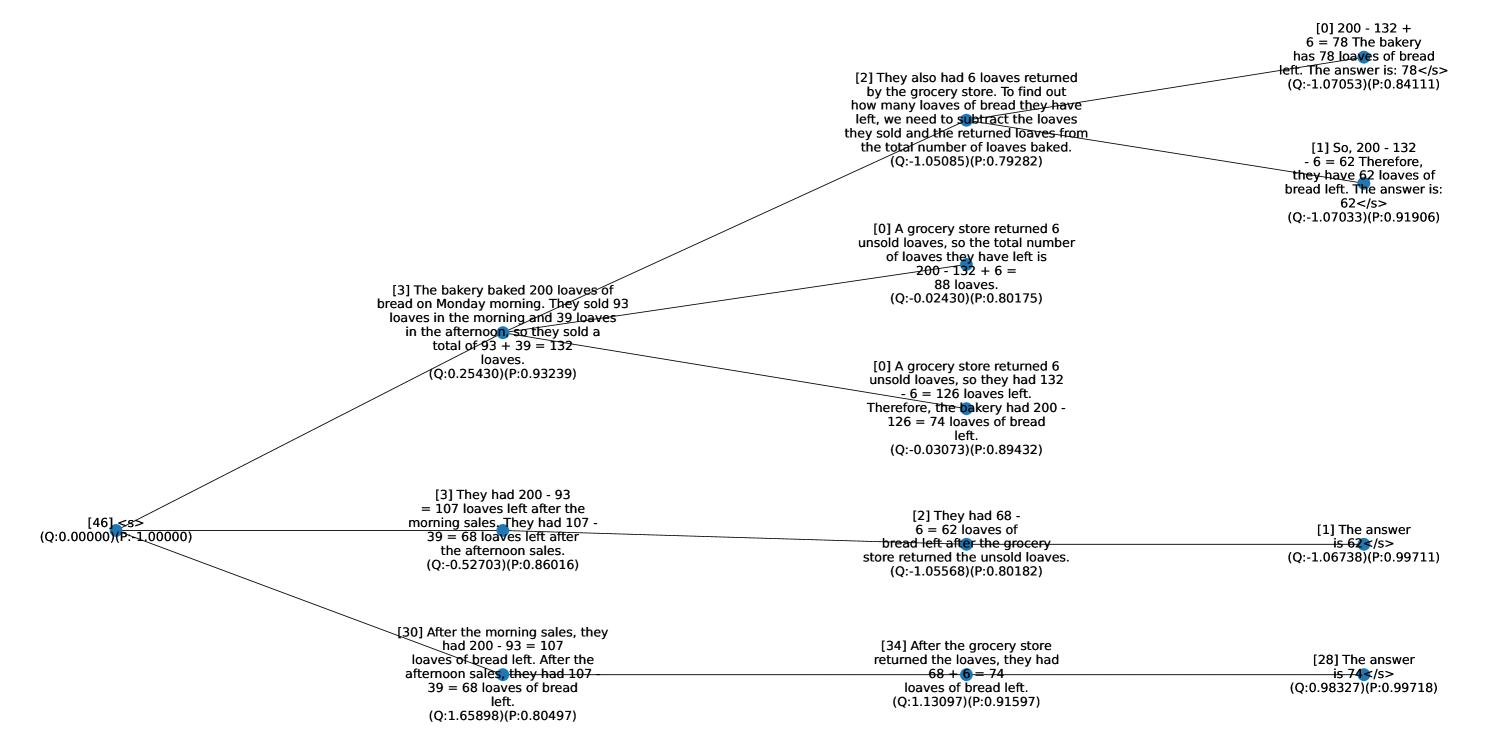
The image depicts a decision tree diagram illustrating the calculation of the number of bread loaves remaining at a bakery after various transactions (baking, selling, returns). Each node represents a state in the calculation, with branches representing different events or operations. The tree starts with an initial state and branches out to show different possible outcomes based on the sequence of events.
### Components/Axes
* **Nodes:** Each node contains a text description of the current state of the problem, including the number of loaves and the operations performed. Each node also contains a Q and P value.
* **Branches:** Lines connecting the nodes, representing the flow of the calculation.
* **Root Node:** The starting point of the tree, representing the initial state.
* **Leaf Nodes:** The end points of the tree, representing the final answers.
### Detailed Analysis
Here's a breakdown of the tree, starting from the left and moving to the right:
1. **Root Node:**
* Text: "[46] <s>"
* Q Value: 0.00000
* P Value: -1.00000
2. **First Level Nodes (from left to right):**
* **Top Node:**
* Text: "[3] The bakery baked 200 loaves of bread on Monday morning. They sold 93 loaves in the morning and 39 loaves in the afternoon, so they sold a total of 93 + 39 = 132 loaves."
* Q Value: 0.25430
* P Value: 0.93239
* **Middle Node:**
* Text: "[3] They had 200 - 93 = 107 loaves left after the morning sales. They had 107 - 39 = 68 loaves left after the afternoon sales."
* Q Value: -0.52703
* P Value: 0.86016
* **Bottom Node:**
* Text: "[30] After the morning sales, they had 200 - 93 = 107 loaves of bread left. After the afternoon sales, they had 107 - 39 = 68 loaves of bread left."
* Q Value: 1.65898
* P Value: 0.80497
3. **Second Level Nodes (from left to right):**
* **Top Node:**
* Text: "[0] 200 - 132 + 6 = 78 The bakery has 78 loaves of bread left. The answer is: 78</s>"
* Q Value: -1.07053
* P Value: 0.84111
* **Middle Top Node:**
* Text: "[2] They also had 6 loaves returned by the grocery store. To find out how many loaves of bread they have left, we need to subtract the loaves they sold and the returned loaves from the total number of loaves baked."
* Q Value: -1.05085
* P Value: 0.79282
* **Middle Bottom Node:**
* Text: "[0] A grocery store returned 6 unsold loaves, so they had 132 - 6 = 126 loaves left. Therefore, the bakery had 200 - 126 = 74 loaves of bread left."
* Q Value: -0.03073
* P Value: 0.89432
* **Bottom Node:**
* Text: "[34] After the grocery store returned the loaves, they had 68 + 6 = 74 loaves of bread left."
* Q Value: 1.13097
* P Value: 0.91597
4. **Third Level Nodes (from left to right):**
* **Top Node:**
* Text: "[1] So, 200 - 132 - 6 = 62 Therefore, they have 62 loaves of bread left. The answer is: 62</s>"
* Q Value: -1.07033
* P Value: 0.91906
* **Middle Node:**
* Text: "[0] A grocery store returned 6 unsold loaves, so the total number of loaves they have left is 200 - 132 + 6 = 88 loaves."
* Q Value: -0.02430
* P Value: 0.80175
* **Bottom Node:**
* Text: "[2] They had 68 - 6 = 62 loaves of bread left after the grocery store returned the unsold loaves."
* Q Value: -1.05568
* P Value: 0.80182
5. **Fourth Level Nodes (from left to right):**
* **Top Node:**
* Text: "[1] The answer is 62</s>"
* Q Value: -1.06738
* P Value: 0.99711
* **Bottom Node:**
* Text: "[28] The answer is 74</s>"
* Q Value: 0.98327
* P Value: 0.99718
### Key Observations
* The tree explores different paths based on how the bakery accounts for sales and returns.
* The calculations involve addition and subtraction to track the number of loaves.
* The final answers vary depending on the path taken, reflecting different scenarios.
### Interpretation
The decision tree visualizes the process of calculating the remaining loaves of bread at a bakery. It demonstrates how different sequences of sales and returns affect the final count. The tree highlights the importance of accurately tracking these transactions to determine the correct number of loaves on hand. The Q and P values are not explained in the image, but they likely represent some form of quality and probability metrics associated with each node or calculation.