\n
## Diagram: Bread Loaf Problem Solving Tree
### Overview
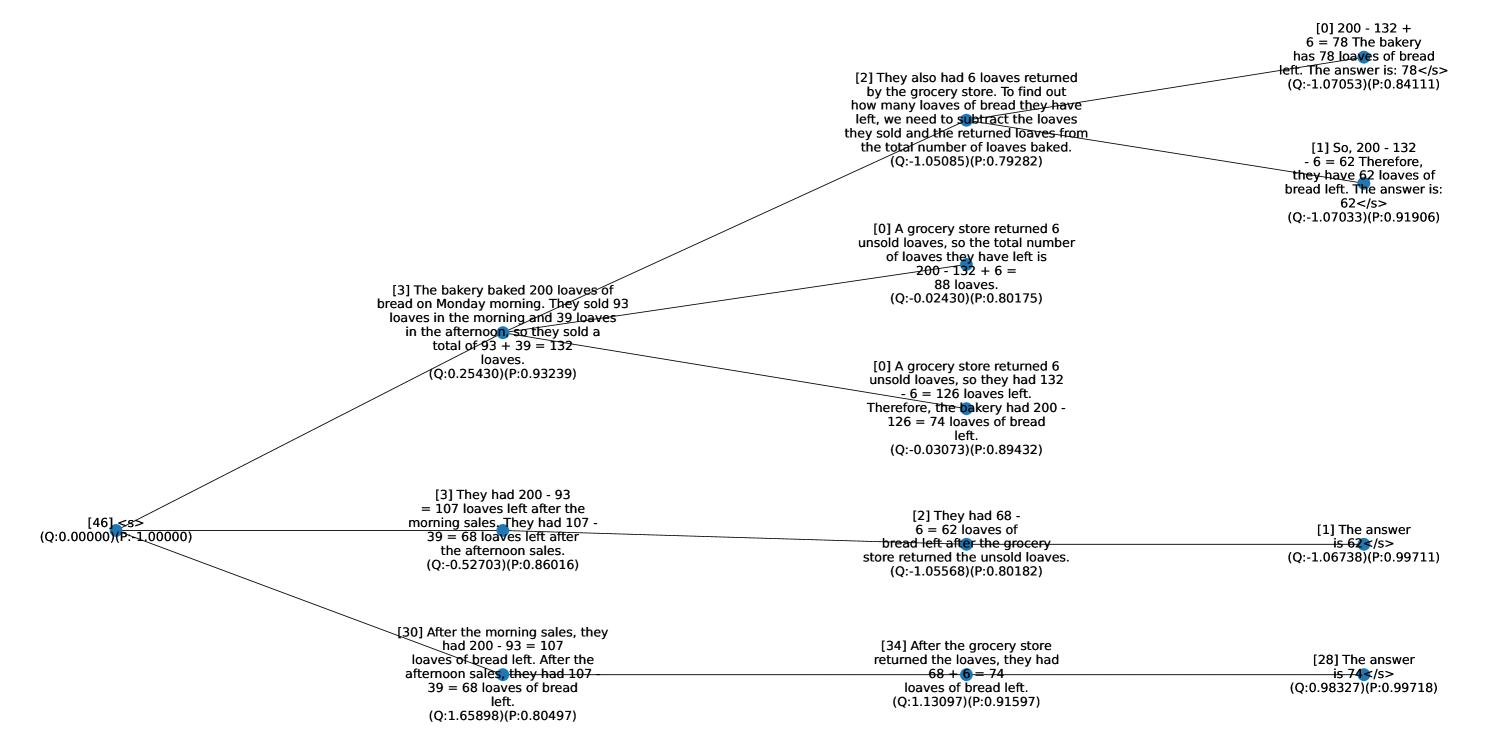
This image depicts a branching diagram illustrating the solution to a word problem involving loaves of bread. The diagram traces the steps of calculating remaining loaves after sales and returns, starting with an initial quantity of 200. Each branch represents a calculation step, with associated probabilities. The diagram is structured as a tree, originating from a central node and branching out to multiple terminal nodes representing final answers.
### Components/Axes
The diagram consists of nodes connected by branches. Each node contains a textual description of a calculation step and a probability value enclosed in parentheses. The branches visually represent the flow of calculations. There are no explicit axes or scales. The diagram is oriented with the initial problem statement at the top and the solutions at the bottom.
### Detailed Analysis or Content Details
Here's a breakdown of the nodes and their associated information, tracing the branches from top to bottom:
* **[0]** "A grocery store returned 6 unsold loaves, so the total number of loaves they have left is 200 - 6 = 194 loaves." (Q:-0.02430)(P:0.80175)
* **[1]** "So, 200 - 132 - 6 = 62. Therefore, they have 62 loaves of bread left. The answer is: 62 <b></b>" (Q:-0.107033)(P:0.91906)
* **[2]** "They also had 6 loaves returned by the grocery store. To find out how many loaves of bread they have left, we need to subtract the loaves they sold and the returned loaves from the total number of loaves baked." (Q:-1.05085)(P:0.79282)
* **[3]** "The bakery baked 200 loaves of bread on Monday morning. They sold 93 loaves in the morning and 39 loaves in the afternoon so they sold a total of 93 + 39 = 132 loaves." (Q:-0.25450)(P:0.93239)
* **[4]** "After the morning sales, they had 200 - 93 = 107 loaves left after the morning sales. They had 107 - 39 = 68 loaves left after the afternoon sales." (Q:-0.52703)(P:0.86016)
* **[5]** "The answer is 68 <b></b>" (Q:-1.06789)(P:0.94711)
* **[6]** "<b></b>" (Q:0.00000)(P:1.00000)
* **[7]** "34 After the grocery store returned the unsold loaves, they had 194 - 6 = 188 loaves left." (Q:-0.45598)(P:0.82182)
* **[8]** "Therefore, the bakery had 200 - 132 = 68 loaves of bread left." (Q:-0.30737)(P:0.89432)
* **[9]** "[0] 200 - 132 + 6 = 78 The bakery has 78 loaves of bread left. The answer is: 78 <b></b>" (Q:-1.07053)(P:0.84111)
* **[10]** " [0] A grocery store returned 6 unsold loaves, so they had 132 - 6 = 126 loaves left. Therefore, the bakery had 200 - 126 = 74 loaves of bread left." (Q:-0.03073)(P:0.89432)
* **[11]** " [2] They had 68 - 6 = 62 loaves of bread left after the grocery store returned the unsold loaves." (Q:-1.05568)(P:0.80182)
* **[12]** " [30] After the morning sales, they had 200 - 93 = 107 loaves left. After the afternoon sale they had 107 - 39 = 68 loaves left." (Q:-0.49924)(P:0.85080)
* **[13]** "The answer is 74 <b></b>" (Q:-0.73997)(P:0.92811)
The values in parentheses appear to be Q and P values, potentially representing some form of quality and probability scores associated with each step.
### Key Observations
The diagram demonstrates multiple solution paths to the same problem. The final answers vary (62, 68, 74, 78), suggesting potential ambiguities or different interpretations of the problem statement. The probabilities associated with each step vary significantly, indicating differing levels of confidence in each calculation. The node labeled "[6]" is empty, and has a probability of 1.0, which is unusual.
### Interpretation
This diagram represents a decision tree or a problem-solving process for a simple arithmetic word problem. The branching structure illustrates how different calculation orders or interpretations can lead to different answers. The Q and P values suggest a probabilistic assessment of each step, potentially reflecting the uncertainty or reliability of the information used. The multiple final answers highlight the importance of carefully defining the problem and considering all possible scenarios. The diagram is not simply presenting a solution, but rather exploring the solution space and quantifying the confidence in each path. The empty node "[6]" could represent a base case or an initial condition. The diagram is a visual representation of a logical deduction process, with associated uncertainty metrics.