## Scatter Plots: Formal and Proof Times of Two Strategies
### Overview
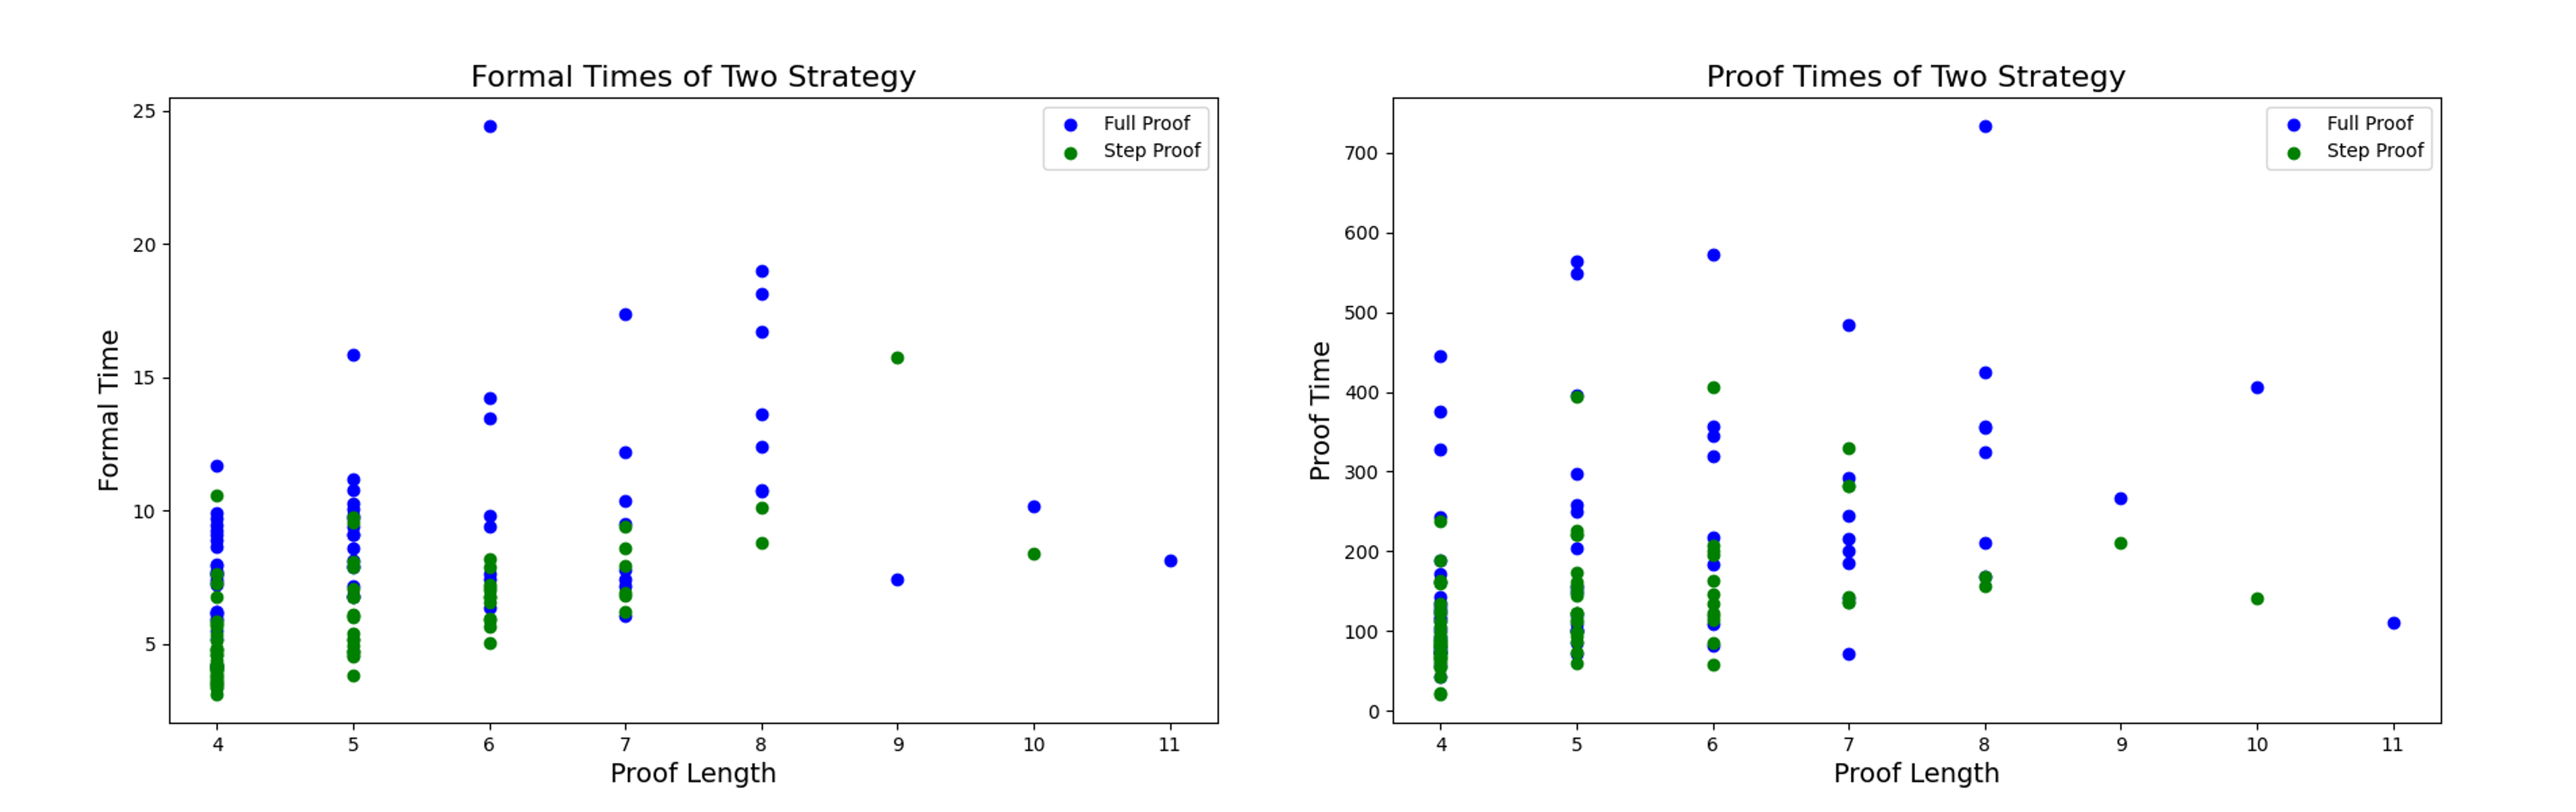
The image contains two scatter plots side-by-side. Both plots compare "Proof Length" on the x-axis against time metrics on the y-axis. The left plot shows "Formal Time" versus "Proof Length," while the right plot shows "Proof Time" versus "Proof Length." Each plot displays two data series: "Full Proof" (blue) and "Step Proof" (green).
### Components/Axes
**Left Plot: Formal Times of Two Strategy**
* **Title:** Formal Times of Two Strategy
* **X-axis:**
* **Label:** Proof Length
* **Scale:** 4 to 11, integer increments
* **Y-axis:**
* **Label:** Formal Time
* **Scale:** 0 to 25, increments of 5
* **Legend:** Located in the top-right corner.
* Blue dot: Full Proof
* Green dot: Step Proof
**Right Plot: Proof Times of Two Strategy**
* **Title:** Proof Times of Two Strategy
* **X-axis:**
* **Label:** Proof Length
* **Scale:** 4 to 11, integer increments
* **Y-axis:**
* **Label:** Proof Time
* **Scale:** 0 to 700, increments of 100
* **Legend:** Located in the top-right corner.
* Blue dot: Full Proof
* Green dot: Step Proof
### Detailed Analysis
**Left Plot: Formal Times of Two Strategy**
* **Full Proof (Blue):**
* At Proof Length 4: Formal Time ranges from approximately 7 to 12.
* At Proof Length 5: Formal Time ranges from approximately 7 to 16.
* At Proof Length 6: Formal Time ranges from approximately 7 to 10.
* At Proof Length 7: Formal Time ranges from approximately 8 to 18.
* At Proof Length 8: Formal Time ranges from approximately 7 to 19.
* At Proof Length 9: Formal Time is approximately 7.
* At Proof Length 10: No data points.
* At Proof Length 11: No data points.
* **Trend:** No clear trend.
* **Step Proof (Green):**
* At Proof Length 4: Formal Time ranges from approximately 3 to 11.
* At Proof Length 5: Formal Time ranges from approximately 4 to 8.
* At Proof Length 6: Formal Time ranges from approximately 5 to 9.
* At Proof Length 7: Formal Time ranges from approximately 6 to 10.
* At Proof Length 8: Formal Time ranges from approximately 7 to 10.
* At Proof Length 9: Formal Time is approximately 16.
* At Proof Length 10: Formal Time is approximately 8.
* At Proof Length 11: No data points.
* **Trend:** No clear trend.
**Right Plot: Proof Times of Two Strategy**
* **Full Proof (Blue):**
* At Proof Length 4: Proof Time ranges from approximately 200 to 450.
* At Proof Length 5: Proof Time ranges from approximately 200 to 570.
* At Proof Length 6: Proof Time ranges from approximately 80 to 490.
* At Proof Length 7: Proof Time ranges from approximately 200 to 350.
* At Proof Length 8: Proof Time ranges from approximately 150 to 300.
* At Proof Length 9: Proof Time ranges from approximately 200 to 250.
* At Proof Length 10: Proof Time is approximately 410.
* At Proof Length 11: Proof Time is approximately 110.
* **Trend:** No clear trend.
* **Step Proof (Green):**
* At Proof Length 4: Proof Time ranges from approximately 10 to 250.
* At Proof Length 5: Proof Time ranges from approximately 50 to 220.
* At Proof Length 6: Proof Time ranges from approximately 50 to 200.
* At Proof Length 7: Proof Time ranges from approximately 50 to 200.
* At Proof Length 8: Proof Time ranges from approximately 50 to 150.
* At Proof Length 9: Proof Time is approximately 210.
* At Proof Length 10: Proof Time is approximately 240.
* At Proof Length 11: No data points.
* **Trend:** No clear trend.
### Key Observations
* Both plots show a wide distribution of time values for each proof length, indicating variability in the time taken for both "Full Proof" and "Step Proof" strategies.
* There are more data points for shorter proof lengths (4-8) than for longer proof lengths (9-11).
* In the "Formal Time" plot, the "Full Proof" strategy appears to have some outliers with higher time values.
* In the "Proof Time" plot, the "Full Proof" strategy generally has higher time values than the "Step Proof" strategy.
### Interpretation
The scatter plots compare the performance of "Full Proof" and "Step Proof" strategies based on "Proof Length." The data suggests that the time taken for both strategies varies significantly for each proof length. The "Proof Time" plot indicates that "Full Proof" generally takes longer than "Step Proof." However, the absence of clear trends suggests that "Proof Length" alone is not a strong predictor of either "Formal Time" or "Proof Time." Other factors likely influence the time taken for each strategy. The data could be used to further investigate the relationship between proof strategy, proof length, and time taken, potentially identifying other variables that contribute to the observed variability.