\n
## Scatter Plots: Formal and Proof Times of Two Strategy
### Overview
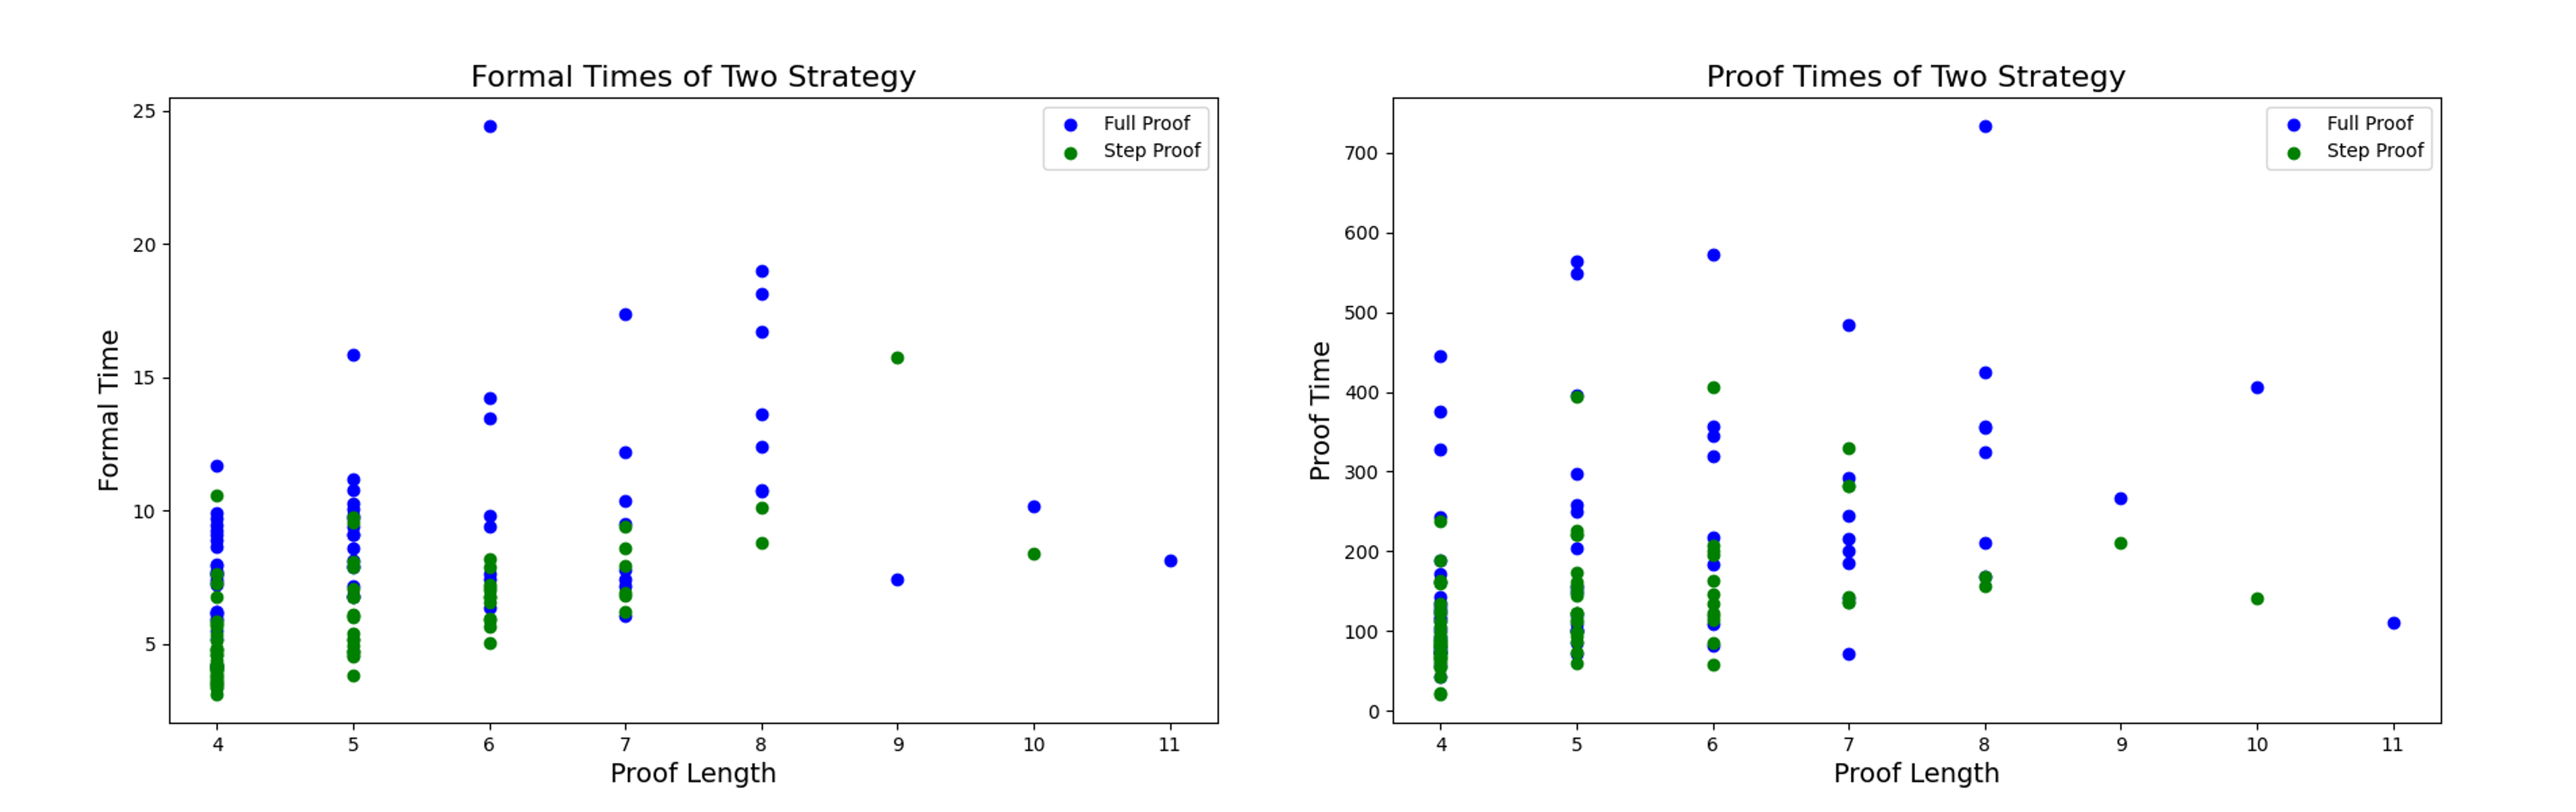
The image presents two scatter plots, side-by-side, comparing "Proof Length" against "Formal Time" in the left plot and "Proof Time" in the right plot, for two strategies: "Full Proof" and "Step Proof". Both plots share the same x-axis ("Proof Length") scale, ranging from approximately 4 to 11. The left plot's y-axis is "Formal Time" ranging from 0 to 25, while the right plot's y-axis is "Proof Time" ranging from 0 to 700.
### Components/Axes
* **Left Plot:**
* Title: "Formal Times of Two Strategy"
* X-axis: "Proof Length" (Scale: 4 to 11)
* Y-axis: "Formal Time" (Scale: 0 to 25)
* Legend:
* "Full Proof" (Color: Blue)
* "Step Proof" (Color: Green)
* **Right Plot:**
* Title: "Proof Times of Two Strategy"
* X-axis: "Proof Length" (Scale: 4 to 11)
* Y-axis: "Proof Time" (Scale: 0 to 700)
* Legend:
* "Full Proof" (Color: Blue)
* "Step Proof" (Color: Green)
### Detailed Analysis or Content Details
**Left Plot: Formal Times of Two Strategy**
* **Full Proof (Blue):** The data points generally cluster between Proof Lengths of 5 and 8, with Formal Times ranging from approximately 5 to 18. There's a general upward trend, but with significant scatter. Specific data points (approximate):
* Proof Length 4.5: Formal Time ~ 8
* Proof Length 5: Formal Time ~ 6, 8, 10, 12, 14
* Proof Length 6: Formal Time ~ 7, 9, 11, 13, 15
* Proof Length 7: Formal Time ~ 10, 12, 14, 16, 18
* Proof Length 8: Formal Time ~ 12, 14, 16
* Proof Length 9: Formal Time ~ 8, 10
* Proof Length 10.5: Formal Time ~ 7
* **Step Proof (Green):** The data points are concentrated between Proof Lengths of 4 and 7, with Formal Times generally below 8. The points are more tightly clustered than the "Full Proof" data. Specific data points (approximate):
* Proof Length 4: Formal Time ~ 2, 3, 4
* Proof Length 5: Formal Time ~ 2, 3, 4, 5
* Proof Length 6: Formal Time ~ 2, 3, 4, 5, 6
* Proof Length 7: Formal Time ~ 3, 4, 5
**Right Plot: Proof Times of Two Strategy**
* **Full Proof (Blue):** The data points are spread across the entire Proof Length range (4 to 11), with Proof Times ranging from approximately 50 to 700. There's a general upward trend, but with substantial scatter. Specific data points (approximate):
* Proof Length 4: Proof Time ~ 100, 150, 200
* Proof Length 5: Proof Time ~ 200, 300, 400, 500
* Proof Length 6: Proof Time ~ 150, 250, 350, 450
* Proof Length 7: Proof Time ~ 200, 300, 400, 500
* Proof Length 8: Proof Time ~ 300, 400, 500, 600
* Proof Length 9: Proof Time ~ 300, 400
* Proof Length 10: Proof Time ~ 200
* Proof Length 11: Proof Time ~ 100
* **Step Proof (Green):** The data points are concentrated between Proof Lengths of 4 and 7, with Proof Times generally below 250. Specific data points (approximate):
* Proof Length 4: Proof Time ~ 50, 100
* Proof Length 5: Proof Time ~ 50, 100, 150
* Proof Length 6: Proof Time ~ 50, 100, 150, 200
* Proof Length 7: Proof Time ~ 100, 150
### Key Observations
* The "Step Proof" strategy consistently exhibits lower "Formal Time" and "Proof Time" compared to the "Full Proof" strategy, especially for shorter "Proof Lengths".
* The "Full Proof" strategy shows a wider range of times, indicating greater variability.
* Both strategies show a general trend of increasing time with increasing "Proof Length", but the relationship is not strictly linear.
* The right plot ("Proof Time") has a much larger scale than the left plot ("Formal Time"), suggesting that "Proof Time" is more sensitive to changes in "Proof Length".
### Interpretation
The data suggests that the "Step Proof" strategy is more efficient than the "Full Proof" strategy, particularly for shorter proofs. The "Full Proof" strategy, while potentially more thorough, appears to be more time-consuming and less predictable in its execution time. The scatter in the "Full Proof" data could indicate that the strategy's performance is more sensitive to the specific characteristics of the proof being attempted. Further investigation could explore these factors to optimize the "Full Proof" strategy or to identify scenarios where it might be preferable to the "Step Proof" strategy.