## Scatter Plot Comparison: Formal and Proof Times of Two Strategies
### Overview
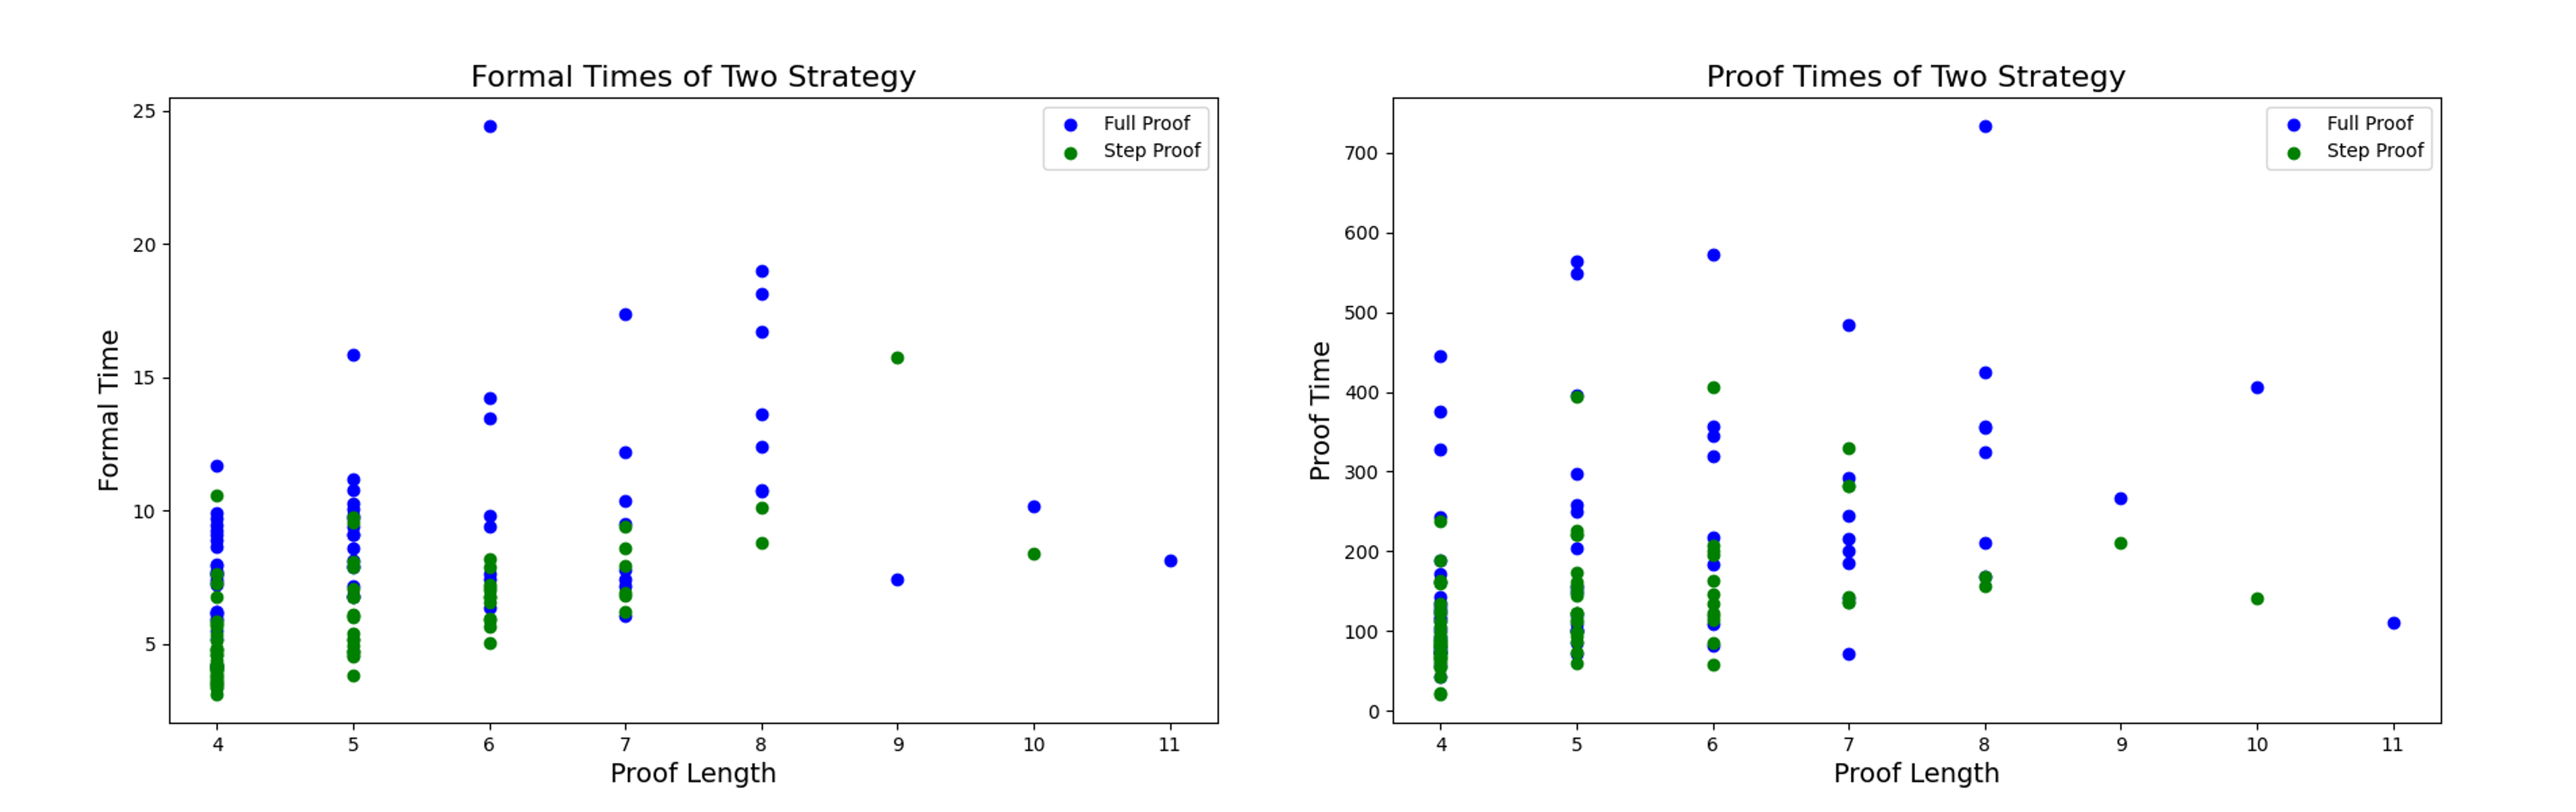
The image displays two side-by-side scatter plots comparing the performance of two proof strategies—"Full Proof" and "Step Proof"—across varying proof lengths. The left plot measures "Formal Time," while the right plot measures "Proof Time." Both plots share the same x-axis ("Proof Length") and legend, allowing for direct comparison of the two metrics.
### Components/Axes
**Titles:**
- Left Plot: "Formal Times of Two Strategy"
- Right Plot: "Proof Times of Two Strategy"
**Axes:**
- **X-axis (both plots):** "Proof Length". Discrete integer values from 4 to 11.
- **Y-axis (Left Plot):** "Formal Time". Linear scale from 0 to 25, with major ticks at 5, 10, 15, 20, 25.
- **Y-axis (Right Plot):** "Proof Time". Linear scale from 0 to 700, with major ticks at 100, 200, 300, 400, 500, 600, 700.
**Legend (Top-right corner of each plot):**
- Blue circle: "Full Proof"
- Green circle: "Step Proof"
### Detailed Analysis
Data points are extracted as approximate values based on visual positioning. For each proof length, the approximate y-values for each strategy are listed.
**Left Plot: Formal Times of Two Strategy**
| Proof Length | Full Proof (Blue) Approx. Formal Time | Step Proof (Green) Approx. Formal Time |
| :--- | :--- | :--- |
| 4 | 6, 8, 9, 9.5, 10, 11.5 | 3, 4, 5, 5.5, 6, 6.5, 7, 7.5, 8, 10.5 |
| 5 | 8.5, 9, 9.5, 10, 10.5, 11, 15.5 | 3.5, 4.5, 5, 5.5, 6, 6.5, 7, 7.5, 8, 8.5, 9, 9.5, 10 |
| 6 | 7.5, 9.5, 10, 13.5, 14, 24.5 | 5, 5.5, 6, 6.5, 7, 7.5, 8, 8.5 |
| 7 | 6, 7, 7.5, 8, 9, 9.5, 10.5, 12, 17.5 | 6, 6.5, 7, 7.5, 8, 8.5, 9, 9.5 |
| 8 | 10.5, 12.5, 13.5, 16.5, 18, 19 | 8.5, 10 |
| 9 | 7.5 | 15.5 |
| 10 | 10 | 8 |
| 11 | 8 | (No data) |
**Right Plot: Proof Times of Two Strategy**
| Proof Length | Full Proof (Blue) Approx. Proof Time | Step Proof (Green) Approx. Proof Time |
| :--- | :--- | :--- |
| 4 | 140, 170, 240, 325, 375, 445 | 20, 40, 50, 60, 70, 80, 90, 100, 110, 120, 130, 140, 150, 160, 170, 180, 190, 240 |
| 5 | 200, 250, 255, 295, 550, 565 | 60, 70, 80, 90, 100, 110, 120, 130, 140, 150, 160, 170, 220, 225, 395 |
| 6 | 105, 180, 215, 315, 345, 355, 575 | 55, 85, 105, 120, 130, 140, 150, 160, 170, 180, 190, 200, 405 |
| 7 | 70, 185, 195, 215, 245, 285, 485 | 135, 140, 280, 290, 330 |
| 8 | 210, 320, 355, 425 | 155, 165, 170 |
| 9 | 265 | 210 |
| 10 | 405 | 140 |
| 11 | 110 | (No data) |
### Key Observations
1. **Formal Time (Left Plot):**
* **Full Proof (Blue):** Shows a wide spread of values at each proof length, with a general upward trend as length increases. Notable high outliers exist at lengths 6 (~24.5) and 8 (~19).
* **Step Proof (Green):** Values are consistently lower and more tightly clustered than Full Proof for lengths 4-8. A single high outlier appears at length 9 (~15.5). No data is present for length 11.
* **Comparison:** Step Proof generally requires less formal time than Full Proof for the same proof length, except for the outlier at length 9.
2. **Proof Time (Right Plot):**
* **Full Proof (Blue):** Exhibits extremely high variance. Times range from under 100 to over 700. There is a very high outlier at length 8 (~730). The trend is not clearly linear; high values appear across various lengths.
* **Step Proof (Green):** Also shows significant variance but is generally lower than Full Proof. The highest value is ~405 at length 6. The data density decreases sharply after length 7.
* **Comparison:** Step Proof tends to have lower proof times than Full Proof, but both strategies show high variability. The most extreme proof time in the dataset belongs to Full Proof at length 8.
3. **Data Density:** Both plots show a higher concentration of data points for lower proof lengths (4-7), with data becoming sparse for lengths 9-11. This suggests the evaluation dataset contained more examples of shorter proofs.
### Interpretation
The data suggests a clear performance difference between the two strategies. **Step Proof is generally more efficient than Full Proof** in terms of both "Formal Time" and "Proof Time" across most proof lengths. This indicates that breaking down the proof process into steps likely reduces the computational overhead compared to attempting a full proof in one go.
However, the **high variance**, especially in Proof Time, is a critical finding. It implies that the difficulty or resource consumption of a proof is not solely determined by its length. Other factors—perhaps the complexity of the logical steps, the specific theorem being proved, or the solver's state—play a significant role. The extreme outlier for Full Proof at length 8 (Proof Time ~730) is a prime example of this unpredictability.
The sparsity of data for longer proofs (lengths 9-11) limits conclusions about strategy scalability. It is unknown if the performance gap widens, narrows, or reverses for very long proofs. The single data point for Step Proof at length 9 (Formal Time ~15.5) is an outlier that contradicts the general trend and would warrant investigation.
In summary, while Step Proof appears to be the more reliable and efficient strategy on average, both methods are subject to significant performance variability. The proof length alone is a poor predictor of the time required, highlighting the need for more nuanced metrics or features to understand proof complexity.