## Scatter Plots: Formal and Proof Times of Two Strategies
### Overview
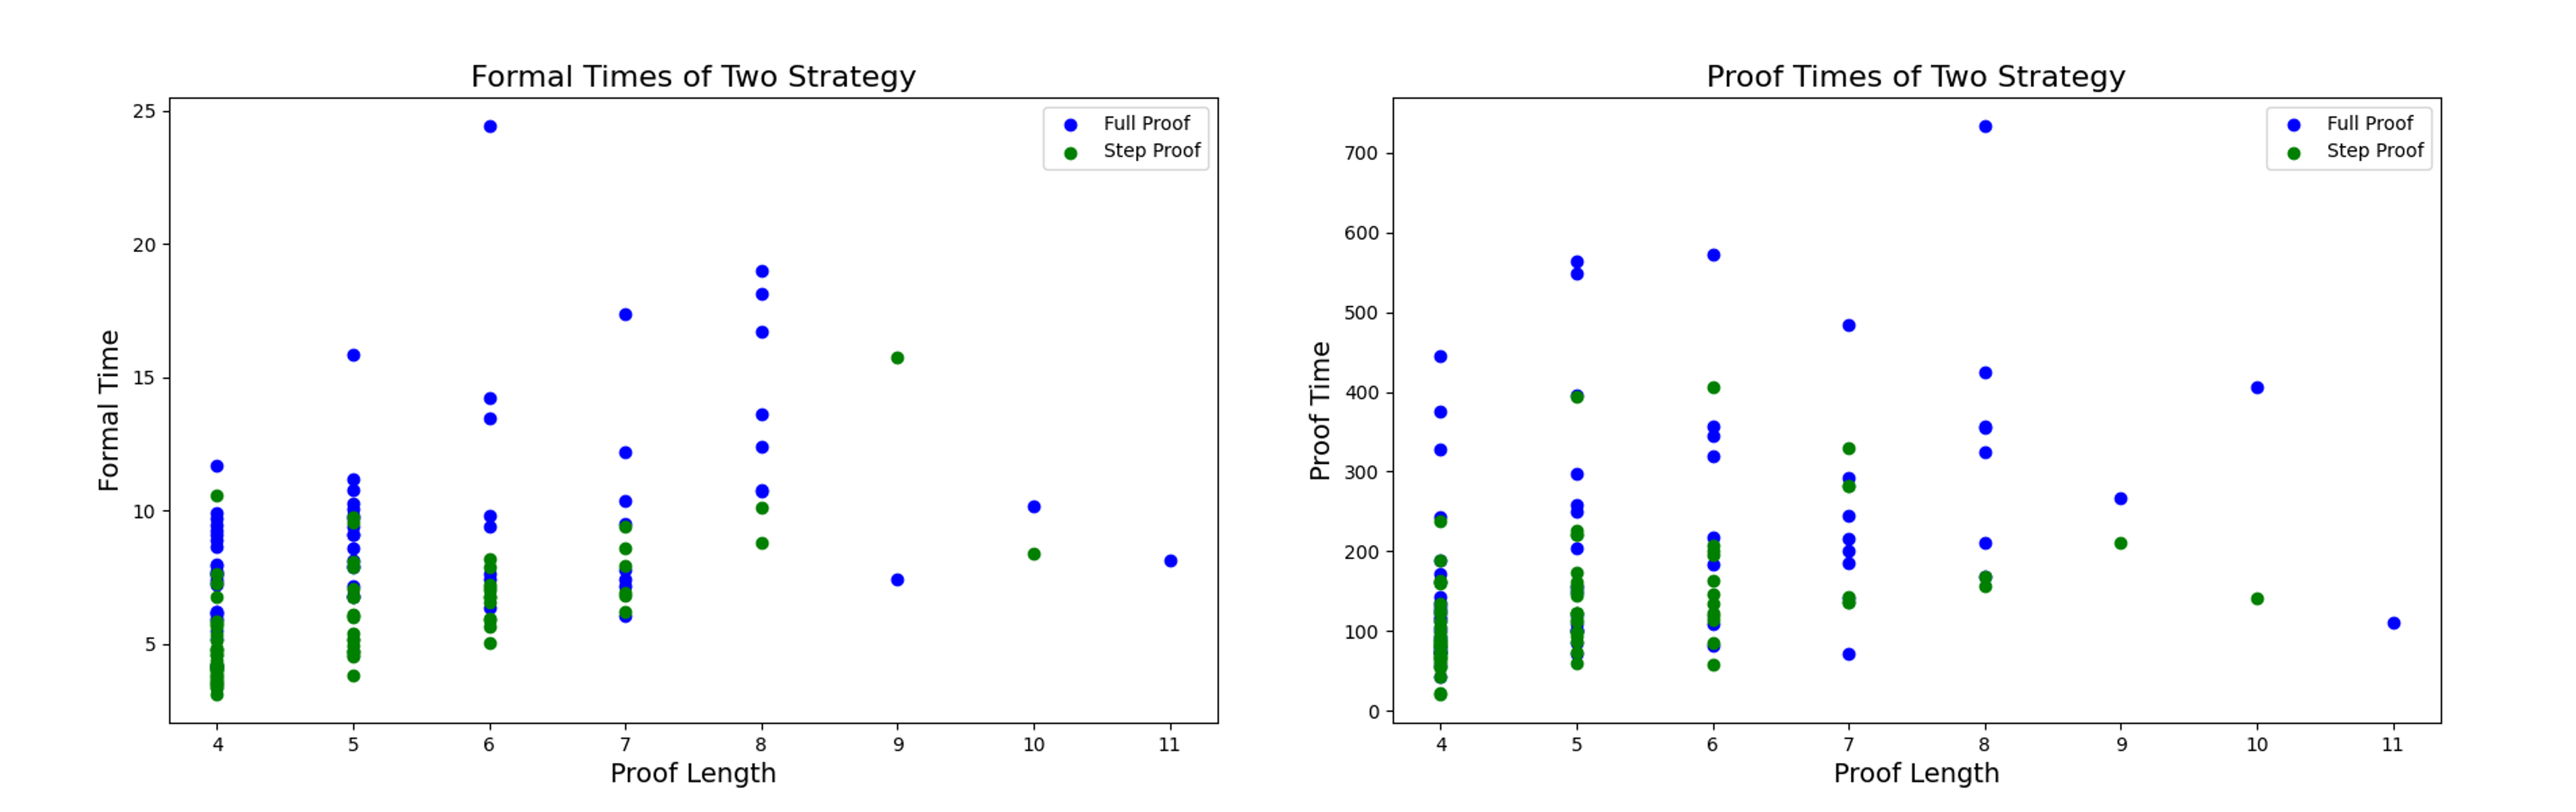
The image contains two side-by-side scatter plots comparing the performance of two proof strategies ("Full Proof" and "Step Proof") across varying proof lengths (4–11). The left plot measures "Formal Time" (y-axis) and the right plot measures "Proof Time" (y-axis), both plotted against "Proof Length" (x-axis). Data points are color-coded: blue for Full Proof, green for Step Proof.
---
### Components/Axes
#### Left Plot: Formal Times of Two Strategy
- **X-axis (Proof Length)**: Discrete values from 4 to 11 (integer scale).
- **Y-axis (Formal Time)**: Continuous scale from 0 to 25.
- **Legend**:
- Blue dots = Full Proof
- Green dots = Step Proof
- **Title**: "Formal Times of Two Strategy"
#### Right Plot: Proof Times of Two Strategy
- **X-axis (Proof Length)**: Same as left plot (4–11).
- **Y-axis (Proof Time)**: Continuous scale from 0 to 700.
- **Legend**: Identical to left plot (blue = Full Proof, green = Step Proof).
- **Title**: "Proof Times of Two Strategy"
---
### Detailed Analysis
#### Left Plot: Formal Time Trends
- **Full Proof (Blue)**:
- At Proof Length 4: Formal Time ≈ 12–15 (clustered around 12–15).
- At Proof Length 6: Sharp peak at ~24 (highest value).
- At Proof Length 8: Values drop to ~10–12.
- At Proof Length 11: Lowest value (~7).
- **Step Proof (Green)**:
- Consistently lower than Full Proof across all lengths.
- At Proof Length 9: Peaks at ~15 (highest for Step Proof).
- At Proof Length 11: Drops to ~5.
#### Right Plot: Proof Time Trends
- **Full Proof (Blue)**:
- At Proof Length 4: ~300–400.
- At Proof Length 8: Peaks at ~700 (highest value).
- At Proof Length 11: Drops to ~100.
- **Step Proof (Green)**:
- At Proof Length 4: ~200–250.
- At Proof Length 8: ~200 (lower than Full Proof).
- At Proof Length 11: ~50 (lowest value).
---
### Key Observations
1. **Inverse Relationship**: Both strategies show decreasing times as Proof Length increases, but Full Proof exhibits higher variability.
2. **Peak at Length 8**: Full Proof reaches its maximum Proof Time (~700) at Proof Length 8, while Step Proof remains stable.
3. **Efficiency Gap**: Step Proof consistently requires less time than Full Proof (e.g., at Proof Length 11, Step Proof is ~50 vs. Full Proof’s ~100).
4. **Outlier at Length 6**: Full Proof’s Formal Time spikes to ~24, far exceeding other lengths.
---
### Interpretation
- **Efficiency of Step Proof**: Step Proof demonstrates superior efficiency, requiring significantly less time across all proof lengths. This suggests it may be preferable for practical applications.
- **Full Proof’s Scalability**: Despite higher resource consumption, Full Proof’s time decreases with longer proofs, potentially indicating better handling of complex cases.
- **Anomaly at Length 6**: The spike in Formal Time for Full Proof at Proof Length 6 warrants investigation—could reflect computational bottlenecks or edge-case handling.
The data implies a trade-off: Step Proof optimizes speed, while Full Proof may offer robustness for longer proofs at the cost of higher resource usage.