\n
## Charts: Model Confidence and Accuracy Evaluation
### Overview
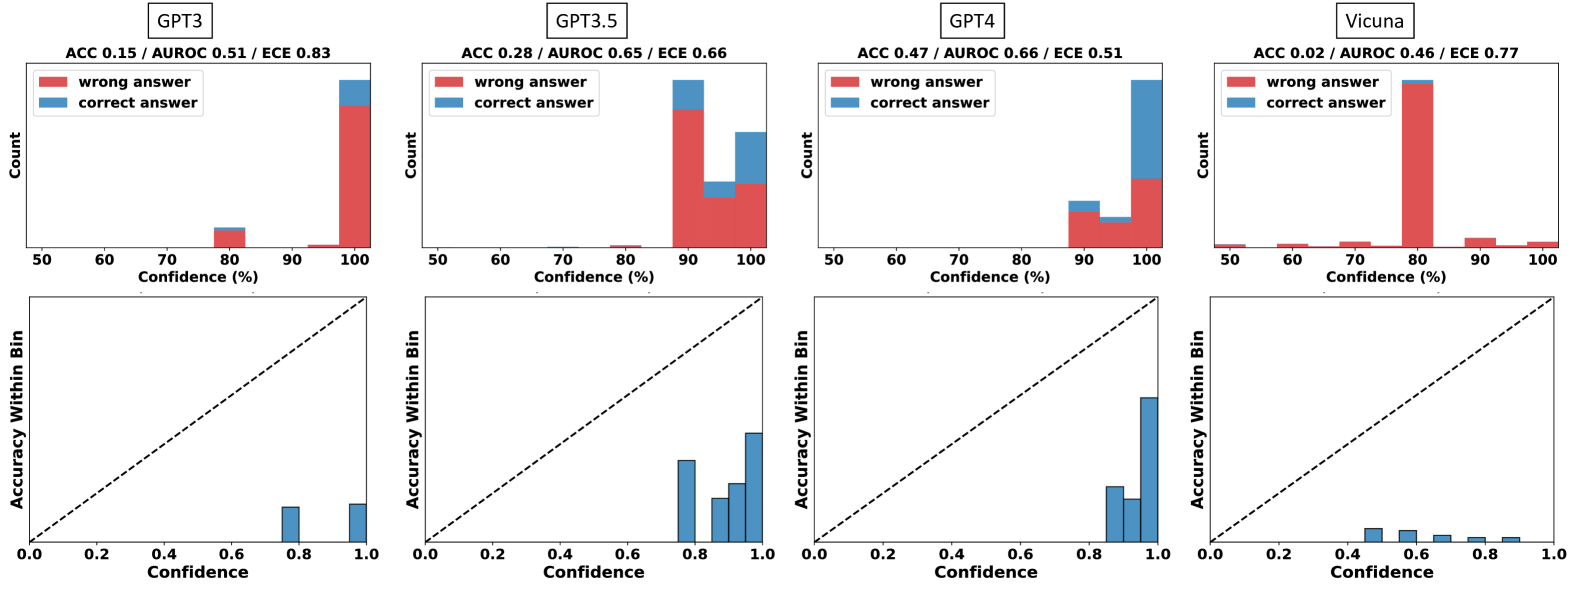
The image presents a comparative analysis of four Large Language Models (GPT-3, GPT-3.5, GPT-4, and Vicuna) based on their confidence levels and accuracy in answering questions. Each model is evaluated with two charts: a histogram showing the distribution of confidence scores for correct and incorrect answers, and a reliability diagram plotting accuracy within confidence bins.
### Components/Axes
Each set of charts (one for each model) shares the following components:
* **Top Chart (Histogram):**
* **X-axis:** Confidence (%) - Scale ranges from 0 to 100, with markers at 50, 60, 70, 80, 90, and 100.
* **Y-axis:** Count - Represents the number of answers falling within each confidence bin.
* **Legend:**
* Red: "wrong answer"
* Teal: "correct answer"
* **Bottom Chart (Reliability Diagram):**
* **X-axis:** Confidence - Scale ranges from 0.0 to 1.0, with markers at 0.2, 0.4, 0.6, 0.8, and 1.0.
* **Y-axis:** Accuracy Within Bin - Represents the actual accuracy of the model's predictions within each confidence bin.
* **Diagonal Line:** Represents perfect calibration (i.e., predicted confidence matches actual accuracy).
* **Model Labels:** Each chart set is labeled with the model name (GPT-3, GPT-3.5, GPT-4, Vicuna) and associated metrics: ACC (Accuracy), AUROC (Area Under the Receiver Operating Characteristic curve), and ECE (Expected Calibration Error).
### Detailed Analysis or Content Details
**GPT-3:**
* ACC: 0.15
* AUROC: 0.52
* ECE: 0.83
* **Histogram:** The majority of answers (approximately 70-80) fall within the 80-100% confidence range, and are incorrect (red). A smaller number of answers (approximately 20-30) fall within the 50-80% confidence range, with a mix of correct (teal) and incorrect (red) answers.
* **Reliability Diagram:** The teal line (accuracy) is significantly below the diagonal dashed line, indicating poor calibration. The model is overconfident in its predictions.
**GPT-3.5:**
* ACC: 0.28
* AUROC: 0.65
* ECE: 0.66
* **Histogram:** A large number of answers (approximately 80-90) fall within the 80-100% confidence range, and are incorrect (red). A smaller number of answers (approximately 20-30) fall within the 50-80% confidence range, with a mix of correct (teal) and incorrect (red) answers.
* **Reliability Diagram:** The teal line is below the diagonal, but closer than GPT-3, indicating some improvement in calibration. The model is still overconfident, but to a lesser extent.
**GPT-4:**
* ACC: 0.47
* AUROC: 0.66
* ECE: 0.51
* **Histogram:** A substantial number of answers (approximately 60-70) fall within the 80-100% confidence range, and are incorrect (red). A significant number of answers (approximately 40-50) fall within the 50-80% confidence range, with a mix of correct (teal) and incorrect (red) answers.
* **Reliability Diagram:** The teal line is closer to the diagonal than GPT-3 and GPT-3.5, indicating better calibration. The model is still slightly overconfident, but significantly improved.
**Vicuna:**
* ACC: 0.02
* AUROC: 0.46
* ECE: 0.77
* **Histogram:** The vast majority of answers (approximately 90-100) fall within the 80-100% confidence range, and are incorrect (red). Very few answers (approximately 5-10) fall within the 50-80% confidence range, with a mix of correct (teal) and incorrect (red) answers.
* **Reliability Diagram:** The teal line is significantly below the diagonal and exhibits a non-monotonic trend (it dips below the line and then rises slightly), indicating very poor calibration and potentially erratic behavior. The model is severely overconfident and unreliable.
### Key Observations
* GPT-4 demonstrates the highest accuracy (0.47) and best calibration (lowest ECE of 0.51).
* Vicuna exhibits the lowest accuracy (0.02) and worst calibration (highest ECE of 0.77).
* All models show a tendency towards overconfidence, as evidenced by the accuracy lines being below the diagonal in the reliability diagrams.
* The histograms consistently show a large number of incorrect answers being assigned high confidence scores.
### Interpretation
The data suggests a clear hierarchy in model performance, with GPT-4 being the most reliable and accurate, followed by GPT-3.5, GPT-3, and finally Vicuna. The reliability diagrams highlight the importance of calibration – a well-calibrated model's confidence scores should accurately reflect its actual accuracy. The consistently low accuracy and poor calibration of Vicuna raise concerns about its reliability. The overconfidence observed across all models suggests a need for further research into techniques for improving calibration and ensuring that models accurately reflect their uncertainty. The ECE metric provides a quantitative measure of this miscalibration, with lower values indicating better calibration. The AUROC metric indicates the model's ability to distinguish between correct and incorrect answers, with higher values indicating better performance. The combination of these metrics provides a comprehensive assessment of model performance and reliability.