TECHNICAL ASSET FINGERPRINT
0de7e719668d055d457f13f8
Click to view fullscreen
Press ESC or click to close
FOUND IN PAPERS
EXPERT: healer-alpha-free VERSION 1
RUNTIME: free/openrouter/healer-alpha
INTEL_VERIFIED
## Statistical Calibration Analysis: Four Language Models
### Overview
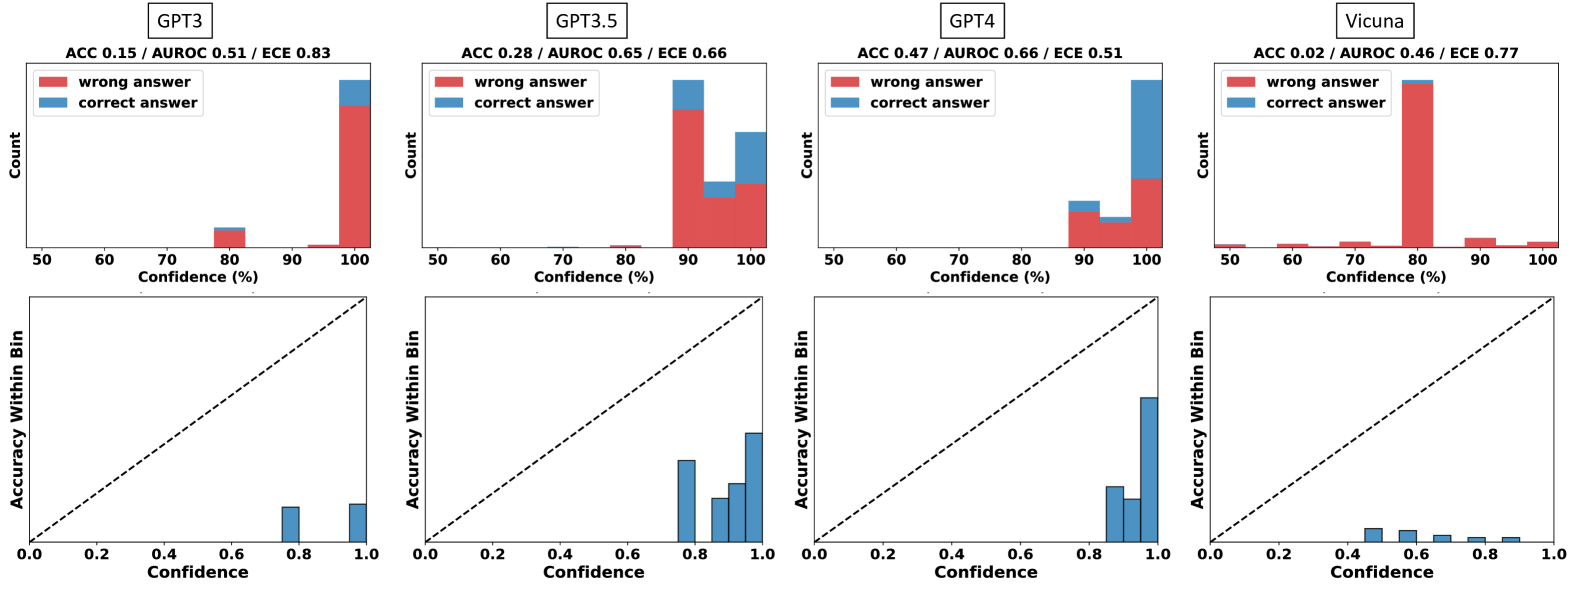
The image presents a 2x4 grid of statistical plots analyzing the confidence calibration of four different language models: GPT3, GPT3.5, GPT4, and Vicuna. Each model has two associated plots: a top histogram showing the distribution of confidence scores for correct vs. incorrect answers, and a bottom calibration plot comparing the model's confidence to its actual accuracy within confidence bins.
### Components/Axes
**Global Structure:**
- The image is divided into four vertical columns, one per model.
- Each column is labeled at the top with the model name in a box: `GPT3`, `GPT3.5`, `GPT4`, `Vicuna`.
- Below each model name, three performance metrics are listed: `ACC` (Accuracy), `AUROC` (Area Under the Receiver Operating Characteristic curve), and `ECE` (Expected Calibration Error).
**Top Row (Histograms):**
- **Y-axis:** Labeled `Count`. Represents the number of responses.
- **X-axis:** Labeled `Confidence (%)`. Ranges from 50 to 100.
- **Legend:** Located in the top-left corner of each histogram. Contains two entries:
- A red square labeled `wrong answer`.
- A blue square labeled `correct answer`.
- **Data Representation:** Stacked bar charts. The total height of a bar at a given confidence bin represents the total number of responses in that bin. The bar is segmented into red (bottom) for wrong answers and blue (top) for correct answers.
**Bottom Row (Calibration Plots):**
- **Y-axis:** Labeled `Accuracy Within Bin`. Ranges from 0.0 to 1.0.
- **X-axis:** Labeled `Confidence`. Ranges from 0.0 to 1.0.
- **Reference Line:** A dashed black diagonal line runs from the bottom-left corner (0.0, 0.0) to the top-right corner (1.0, 1.0). This represents perfect calibration, where confidence equals accuracy.
- **Data Representation:** Blue vertical bars. The height of each bar represents the actual accuracy for responses falling within that confidence bin.
### Detailed Analysis
**Column 1: GPT3**
- **Metrics:** `ACC 0.15 / AUROC 0.51 / ECE 0.83`
- **Top Histogram:**
- The distribution is heavily skewed to the right. The vast majority of responses are in the 90-100% confidence bins.
- The bin at 100% confidence is the tallest, composed almost entirely of red (`wrong answer`), with a very small blue segment (`correct answer`) on top.
- A much smaller bar exists at 80% confidence, also predominantly red.
- Very few responses are in bins below 80%.
- **Bottom Calibration Plot:**
- Bars are present only in the high-confidence region (0.8 to 1.0).
- The bars are significantly shorter than the dashed diagonal line. For example, the bar near confidence 0.8 has an accuracy of approximately 0.15, and the bar near 1.0 has an accuracy of approximately 0.2.
- This indicates severe **overconfidence**: the model's stated confidence is much higher than its actual accuracy.
**Column 2: GPT3.5**
- **Metrics:** `ACC 0.28 / AUROC 0.65 / ECE 0.66`
- **Top Histogram:**
- Responses are concentrated in the 90-100% confidence range.
- The 90% bin is the tallest, with a large red segment and a smaller blue segment.
- The 100% bin is shorter than the 90% bin but has a larger proportion of blue (correct answers) relative to red.
- A very small bar exists at 80% confidence.
- **Bottom Calibration Plot:**
- Bars are clustered between confidence 0.7 and 1.0.
- The bars are closer to the diagonal line than GPT3's but still consistently below it. For instance, at confidence ~0.9, accuracy is ~0.5.
- This shows **overconfidence**, though less severe than GPT3.
**Column 3: GPT4**
- **Metrics:** `ACC 0.47 / AUROC 0.66 / ECE 0.51`
- **Top Histogram:**
- The distribution is concentrated in the 90-100% confidence range.
- The 100% confidence bin is the tallest and has a very large blue segment, indicating a high volume of correct answers at maximum confidence.
- The 90% bin is shorter and has a more even mix of red and blue.
- **Bottom Calibration Plot:**
- Bars are present from confidence ~0.8 to 1.0.
- The bars are the closest to the diagonal line among the first three models. The bar at confidence ~1.0 reaches an accuracy of nearly 0.8.
- This indicates the best calibration of the group, though still with some **overconfidence** at the highest bins.
**Column 4: Vicuna**
- **Metrics:** `ACC 0.02 / AUROC 0.46 / ECE 0.77`
- **Top Histogram:**
- The distribution is unique. The tallest bar is at 80% confidence and is almost entirely red.
- There are small, scattered bars across the entire range from 50% to 100%, all predominantly red.
- The blue segments (`correct answer`) are negligible across all bins.
- **Bottom Calibration Plot:**
- Bars are very short and spread thinly across the confidence range from ~0.4 to 1.0.
- All bars are far below the diagonal line. For example, at confidence 0.6, accuracy is near 0.05.
- This indicates **extreme overconfidence** and very poor performance (ACC 0.02). The model is confidently wrong across a wide range of confidence levels.
### Key Observations
1. **Confidence Distribution:** GPT3, GPT3.5, and GPT4 all exhibit a strong bias toward predicting with very high confidence (90-100%). Vicuna's confidence is more spread out but peaks at 80%.
2. **Calibration Trend:** There is a clear progression in calibration quality from GPT3 (worst) to GPT4 (best), as evidenced by the ECE metric decreasing (0.83 -> 0.66 -> 0.51) and the calibration bars approaching the diagonal line.
3. **Accuracy vs. Confidence:** For all models, the highest confidence bins contain a mix of correct and incorrect answers. However, the proportion of correct answers (blue) in these bins increases with model capability (GPT3 < GPT3.5 < GPT4).
4. **Vicuna Anomaly:** Vicuna is a significant outlier. It has near-zero accuracy (ACC 0.02) yet maintains moderate to high confidence, resulting in a histogram of wrong answers spread across the confidence spectrum and a calibration plot showing almost no relationship between confidence and accuracy.
### Interpretation
This visualization is a diagnostic tool for assessing **model reliability**. It goes beyond simple accuracy (ACC) to answer: "When a model says it is 90% confident, is it right 90% of the time?"
- **What the data suggests:** The data demonstrates that larger, more capable models (GPT4) are not only more accurate but also better **calibrated**—their confidence scores are more meaningful indicators of likely correctness. In contrast, less capable models (GPT3, Vicuna) are **overconfident**, meaning their high confidence scores are unreliable and often indicate incorrect answers.
- **How elements relate:** The top histogram shows *how often* the model uses different confidence levels and its success rate at each. The bottom calibration plot directly tests the *validity* of those confidence levels by comparing them to empirical accuracy. A well-calibrated model would have its blue bars align with the dashed line.
- **Notable implications:** For applications requiring trustworthy uncertainty estimates (e.g., medical diagnosis, high-stakes decision support), using a poorly calibrated model like GPT3 or Vicuna is dangerous. Their high confidence does not guarantee correctness. GPT4, while better, still shows some overconfidence, suggesting caution is needed even with advanced models. The extreme case of Vicuna (ACC 0.02) highlights a failure mode where a model can be consistently wrong yet express varying degrees of confidence, providing no useful signal.
DECODING INTELLIGENCE...