## Bar Charts: Model Performance by Confidence Level
### Overview
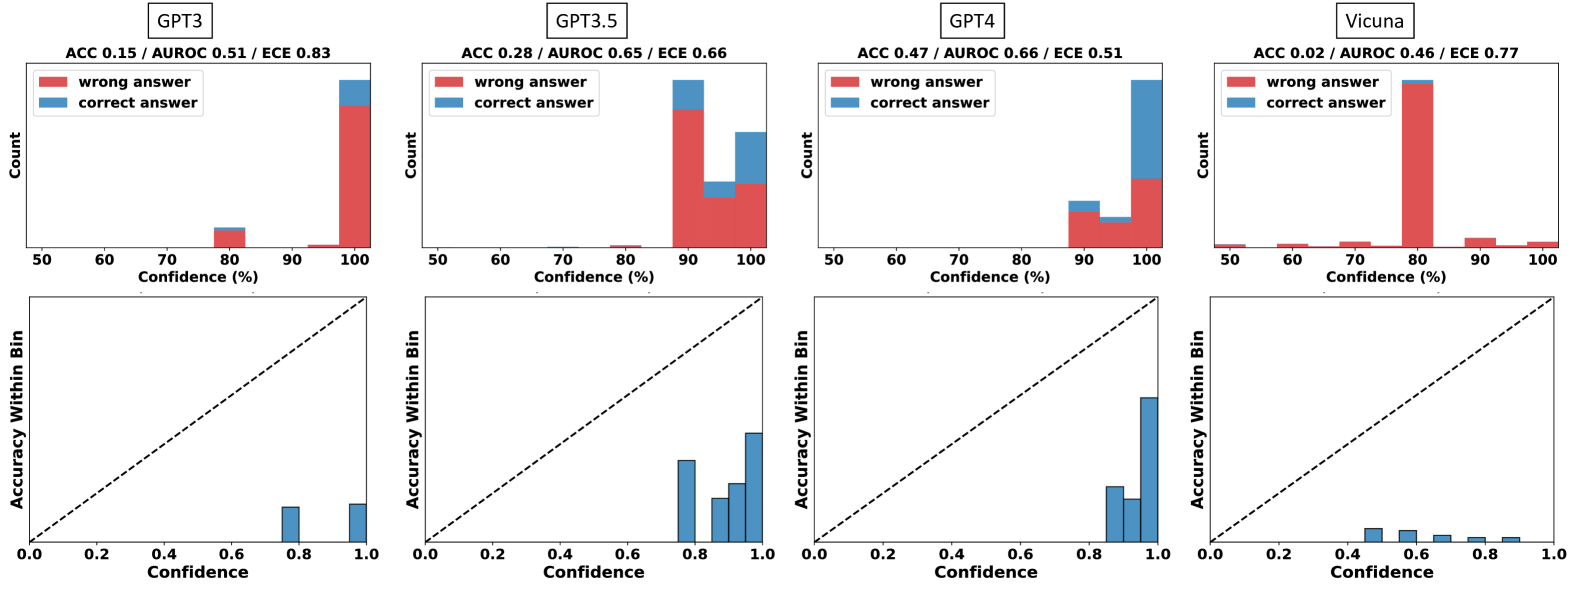
Four bar charts compare model performance (GPT3, GPT3.5, GPT4, Vicuna) across confidence levels (50-100%) using red (wrong answers) and blue (correct answers). Each chart includes accuracy (ACC), AUROC, and expected calibration error (ECE) metrics.
### Components/Axes
- **X-axis**: Confidence (%) from 50 to 100 in 10% increments
- **Y-axis**: Count of answers
- **Legend**: Red = wrong answers, Blue = correct answers
- **Model Labels**: Positioned above each chart (e.g., "GPT3", "GPT3.5")
### Detailed Analysis
1. **GPT3**
- **ACC 0.15 / AUROC 0.51 / ECE 0.83**
- **100% Confidence**: ~100 wrong answers (red), ~5 correct (blue)
- **80% Confidence**: ~10 wrong answers (red), ~5 correct (blue)
2. **GPT3.5**
- **ACC 0.28 / AUROC 0.65 / ECE 0.66**
- **90% Confidence**: ~80 wrong answers (red), ~20 correct (blue)
- **100% Confidence**: ~20 wrong answers (red), ~10 correct (blue)
3. **GPT4**
- **ACC 0.47 / AUROC 0.66 / ECE 0.51**
- **90% Confidence**: ~30 wrong answers (red), ~70 correct (blue)
- **100% Confidence**: ~10 wrong answers (red), ~90 correct (blue)
4. **Vicuna**
- **ACC 0.02 / AUROC 0.46 / ECE 0.77**
- **80% Confidence**: ~100 wrong answers (red), ~5 correct (blue)
- **90% Confidence**: ~5 wrong answers (red), ~5 correct (blue)
### Key Observations
- **High Confidence ≠ High Accuracy**: All models show significant wrong answers at 100% confidence, with Vicuna having the worst performance (100 wrong at 80% confidence).
- **GPT4 Outperforms Others**: GPT4 has the highest correct answer counts at 100% confidence (~90) and lowest ECE (0.51).
- **Calibration Issues**: High ECE values (e.g., Vicuna's 0.77) indicate poor confidence-accuracy alignment.
### Interpretation
The data reveals that confidence metrics do not reliably predict correctness. GPT4 demonstrates superior calibration and accuracy at high confidence levels, while Vicuna exhibits severe overconfidence (high wrong answers at moderate confidence). The ECE metric highlights systemic calibration failures across models, suggesting confidence scores should not be taken at face value for decision-making.
---
## Scatter Plots: Accuracy Within Confidence Bins
### Overview
Four scatter plots show accuracy (y-axis) vs. confidence (x-axis) for the same models. Blue bars represent accuracy within confidence bins, with a dashed diagonal line indicating perfect calibration.
### Components/Axes
- **X-axis**: Confidence (0 to 1.0 in 0.1 increments)
- **Y-axis**: Accuracy within bin (0 to 1.0)
- **Dashed Line**: Perfect calibration reference (y=x)
- **Model Labels**: Positioned above each plot
### Detailed Analysis
1. **GPT3**
- **Bars at 0.8 and 1.0 confidence**: Accuracy ~0.8 and ~0.95
- **Trend**: Slightly above diagonal line at high confidence
2. **GPT3.5**
- **Bars at 0.8, 0.9, and 1.0 confidence**: Accuracy ~0.7, ~0.85, ~0.9
- **Trend**: Consistently above diagonal line
3. **GPT4**
- **Bars at 0.8, 0.9, and 1.0 confidence**: Accuracy ~0.85, ~0.95, ~0.98
- **Trend**: Closest to perfect calibration at high confidence
4. **Vicuna**
- **Bars at 0.4, 0.6, 0.8, and 1.0 confidence**: Accuracy ~0.3, ~0.5, ~0.7, ~0.9
- **Trend**: Below diagonal line at low confidence, improving at high confidence
### Key Observations
- **GPT4's Calibration**: Accuracy closely matches confidence at high levels (e.g., 0.98 accuracy at 1.0 confidence).
- **Vicuna's Overconfidence**: High confidence (0.8-1.0) correlates with moderate accuracy (~0.7-0.9), indicating overestimation.
- **GPT3's Moderate Performance**: Accuracy lags behind confidence at lower levels but improves at high confidence.
### Interpretation
The scatter plots confirm that GPT4 exhibits the best calibration, with accuracy closely tracking confidence. Vicuna's data suggests significant overconfidence, particularly at moderate confidence levels. These patterns underscore the need for calibration-aware confidence thresholds in practical applications.