\n
## Heatmap Chart: Performance Comparison of Gemini 1.5 Pro vs. Whisper + GPT-4 Turbo
### Overview
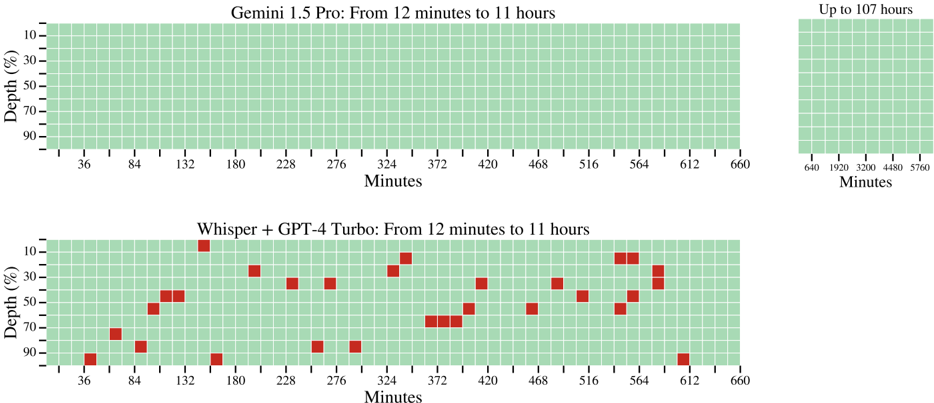
The image displays two horizontally aligned heatmap charts comparing the performance of two AI systems over extended time durations. The top chart represents "Gemini 1.5 Pro," and the bottom chart represents "Whisper + GPT-4 Turbo." Both charts plot performance against time (in minutes) and depth (as a percentage). A small inset chart in the top-right corner provides an extended timeline view for the Gemini 1.5 Pro system.
### Components/Axes
* **Main Charts (Top & Bottom):**
* **Title (Top):** "Gemini 1.5 Pro: From 12 minutes to 11 hours"
* **Title (Bottom):** "Whisper + GPT-4 Turbo: From 12 minutes to 11 hours"
* **X-Axis Label (Both):** "Minutes"
* **X-Axis Scale (Both):** Linear scale with major tick marks at 36, 84, 132, 180, 228, 276, 324, 372, 420, 468, 516, 564, 612, and 660 minutes.
* **Y-Axis Label (Both):** "Depth (%)"
* **Y-Axis Scale (Both):** Linear scale with major tick marks at 10, 30, 50, 70, and 90 percent.
* **Legend/Color Code (Implied):** The grid cells are colored. Green indicates successful performance or a "pass" state. Red indicates a failure or an "error" state.
* **Inset Chart (Top-Right):**
* **Title:** "Up to 107 hours"
* **X-Axis Label:** "Minutes"
* **X-Axis Scale:** Linear scale with major tick marks at 640, 1920, 3200, 4480, and 5760 minutes.
* **Y-Axis:** Shares the same "Depth (%)" scale as the main charts (10-90%).
* **Content:** A solid green grid, indicating consistent performance across all depths for the extended duration.
### Detailed Analysis
**1. Gemini 1.5 Pro Chart (Top Main Chart):**
* **Trend Verification:** The entire grid, spanning from 36 to 660 minutes on the x-axis and 10% to 90% depth on the y-axis, is uniformly filled with green cells.
* **Data Points:** There are no red cells visible. This indicates that the Gemini 1.5 Pro system demonstrated a 100% success rate across all tested time intervals (from ~12 minutes to 11 hours) and all depth percentages within this range.
* **Spatial Grounding:** The chart occupies the top-left to center region of the image. The inset is positioned in the top-right corner.
**2. Whisper + GPT-4 Turbo Chart (Bottom Main Chart):**
* **Trend Verification:** The grid shows a scattered pattern of red cells against a green background, indicating intermittent failures.
* **Data Points (Failures - Red Cells):** The following list approximates the location of red cells. Coordinates are given as (Approx. X-minute mark, Approx. Y-depth %).
* (36, 90)
* (84, 70)
* (108, 50) - *Between 84 and 132*
* (120, 50) - *Between 84 and 132*
* (132, 10)
* (156, 90) - *Between 132 and 180*
* (192, 30) - *Between 180 and 228*
* (228, 30)
* (252, 30) - *Between 228 and 276*
* (264, 90) - *Between 228 and 276*
* (276, 30)
* (300, 90) - *Between 276 and 324*
* (336, 30) - *Between 324 and 372*
* (348, 10) - *Between 324 and 372*
* (372, 70)
* (384, 70) - *Between 372 and 420*
* (396, 50) - *Between 372 and 420*
* (420, 30)
* (456, 50) - *Between 420 and 468*
* (492, 30) - *Between 468 and 516*
* (540, 10) - *Between 516 and 564*
* (540, 30) - *Between 516 and 564*
* (552, 50) - *Between 516 and 564*
* (564, 10)
* (564, 30)
* (576, 30) - *Between 564 and 612*
* (576, 50) - *Between 564 and 612*
* (612, 90)
* **Spatial Grounding:** This chart is positioned directly below the Gemini 1.5 Pro chart, occupying the bottom-left to center region.
### Key Observations
1. **Performance Disparity:** There is a stark contrast between the two systems. Gemini 1.5 Pro shows perfect, consistent performance (all green) across the entire tested matrix. Whisper + GPT-4 Turbo shows significant inconsistency with numerous failures (red cells) scattered across different times and depths.
2. **Failure Pattern in Whisper + GPT-4 Turbo:** Failures do not appear to follow a simple linear trend with time or depth. They occur at various depths (10%, 30%, 50%, 70%, 90%) and at multiple points along the timeline, suggesting the failures may be triggered by specific, complex conditions rather than a simple threshold of time or depth alone.
3. **Extended Capability:** The inset chart explicitly states that Gemini 1.5 Pro's performance remains consistent ("Up to 107 hours"), which is approximately 6480 minutes, far beyond the 660-minute (11-hour) range of the main comparison charts.
### Interpretation
This visualization is a technical benchmark comparing the robustness and reliability of two AI models over long-duration tasks. The "Depth (%)" likely represents a parameter like task complexity, context window utilization, or some measure of processing load.
* **Gemini 1.5 Pro** is presented as a highly reliable system for long-context or sustained processing tasks, maintaining perfect performance from short durations (12 minutes) up to very long ones (107 hours), regardless of the depth parameter within the tested range.
* **Whisper + GPT-4 Turbo** demonstrates vulnerability. Its performance is brittle, with failures occurring unpredictably across the time-depth spectrum. This suggests that the combination of these models may have stability issues or specific failure modes when handling extended or deep processing tasks, making it less suitable for applications requiring consistent, long-duration reliability.
The chart serves as a strong visual argument for the superior stability and scalability of the Gemini 1.5 Pro system in the context being tested. The lack of a clear pattern in the Whisper + GPT-4 Turbo failures implies the need for deeper investigation into the root causes, which could be related to error propagation, context management, or resource limits in the pipeline.