## Heatmap: Gemini 1.5 Pro and Whisper + GPT-4 Turbo Performance Over Time
### Overview
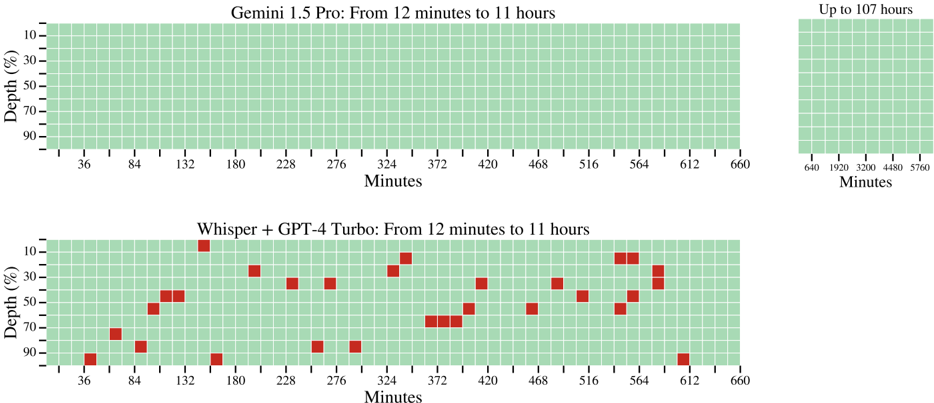
The image contains three heatmaps comparing performance metrics (depth %) across time intervals (minutes) for two AI models:
1. **Gemini 1.5 Pro** (top chart)
2. **Whisper + GPT-4 Turbo** (bottom chart)
3. A third heatmap labeled "Up to 107 hours" (right side)
The top and bottom charts span 12 minutes to 11 hours (660 minutes), while the right chart extends up to 107 hours (6,420 minutes).
---
### Components/Axes
#### Top Chart (Gemini 1.5 Pro):
- **X-axis (Minutes)**: 36, 84, 132, 180, 228, 276, 324, 372, 420, 468, 516, 564, 612, 660
- **Y-axis (Depth %)**: 10, 30, 50, 70, 90
- **Grid**: Light green background with white gridlines.
- **Data Points**: No visible markers or annotations.
#### Bottom Chart (Whisper + GPT-4 Turbo):
- **X-axis (Minutes)**: Same scale as top chart (36–660).
- **Y-axis (Depth %)**: Same scale (10–90%).
- **Grid**: Identical to top chart.
- **Data Points**: Red squares scattered across the grid.
#### Right Chart ("Up to 107 hours"):
- **X-axis (Minutes)**: 640, 1,920, 3,200, 4,480, 5,760
- **Y-axis (Depth %)**: 10, 30, 50, 70, 90
- **Grid**: Light green with white lines.
- **Data Points**: No visible markers.
---
### Detailed Analysis
#### Top Chart (Gemini 1.5 Pro):
- **No data points** are present. The grid is uniformly empty, suggesting either:
- No data collection for this model in the specified time range.
- A placeholder for future data.
#### Bottom Chart (Whisper + GPT-4 Turbo):
- **Red squares** indicate data points at specific (time, depth) coordinates. Key observations:
- **Early Time Intervals (36–132 minutes)**:
- Depths range from 50% to 90%.
- Example: A square at ~84 minutes, 70% depth.
- **Mid-Time Intervals (180–420 minutes)**:
- Depths cluster between 30% and 70%.
- Example: A cluster of squares at ~372 minutes, 50–60% depth.
- **Late Time Intervals (468–660 minutes)**:
- Depths vary widely (10%–90%).
- Example: A square at ~612 minutes, 90% depth.
- **Pattern**: No clear upward/downward trend; data points are sporadic.
#### Right Chart ("Up to 107 hours"):
- **No data points** are visible. The grid is empty, similar to the top chart.
---
### Key Observations
1. **Gemini 1.5 Pro**: No data recorded in the 12-minute–11-hour range.
2. **Whisper + GPT-4 Turbo**:
- Performance (depth %) fluctuates unpredictably over time.
- Higher depths (70–90%) occur sporadically, especially in early and late intervals.
3. **Right Chart**: Purpose unclear; may represent extended monitoring beyond 11 hours.
---
### Interpretation
- **Gemini 1.5 Pro**: The absence of data suggests either a technical limitation, incomplete testing, or a placeholder for future results.
- **Whisper + GPT-4 Turbo**: The scattered red squares imply inconsistent performance. For example:
- At ~372 minutes, multiple squares at 50–60% depth suggest a temporary stabilization.
- The 90% depth at ~612 minutes could indicate a peak performance or anomaly.
- **Right Chart**: The extended time range (up to 107 hours) hints at potential long-term monitoring, but no data is currently available.
**Critical Insight**: The contrast between the two models highlights gaps in data collection or differing operational scopes. Further investigation is needed to determine why Gemini 1.5 Pro lacks data and whether the Whisper + GPT-4 Turbo’s variability reflects real-world performance or testing artifacts.