## Line Chart: Model Performance Comparison
### Overview
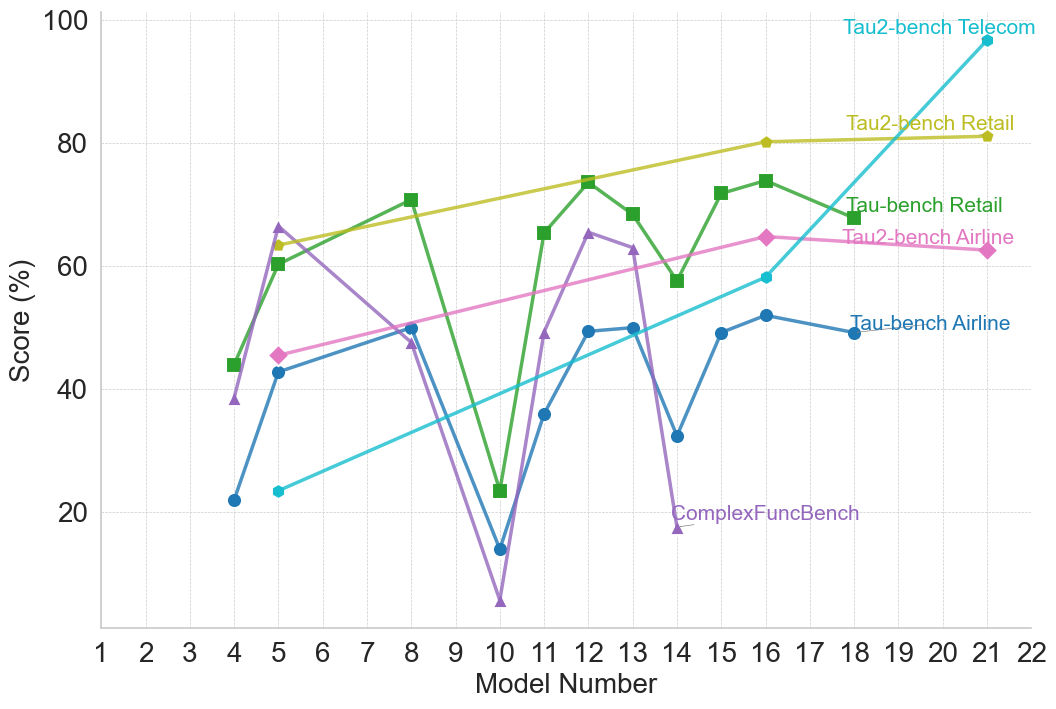
The image is a line chart comparing the performance of different models across a range of model numbers. The y-axis represents the score in percentage, and the x-axis represents the model number. There are five distinct data series, each representing a different model or benchmark, distinguished by color and label.
### Components/Axes
* **X-axis:** "Model Number", ranging from 1 to 22. Axis markers are present at each integer value.
* **Y-axis:** "Score (%)", ranging from 0 to 100. Axis markers are present at intervals of 20 (0, 20, 40, 60, 80, 100).
* **Legend:** Located on the top-right of the chart, identifying each data series by color and label:
* **Teal:** "Tau2-bench Telecom"
* **Yellow:** "Tau2-bench Retail"
* **Green:** "Tau-bench Retail"
* **Pink:** "Tau2-bench Airline"
* **Blue:** "Tau-bench Airline"
* **Purple:** "ComplexFuncBench"
### Detailed Analysis
* **Tau2-bench Telecom (Teal):** This line generally slopes upward.
* Model 4: ~22%
* Model 5: ~23%
* Model 11: ~36%
* Model 16: ~58%
* Model 21: ~98%
* **Tau2-bench Retail (Yellow):** This line is relatively flat, with a slight upward trend.
* Model 5: ~65%
* Model 11: ~70%
* Model 16: ~80%
* Model 21: ~82%
* **Tau-bench Retail (Green):** This line fluctuates.
* Model 4: ~44%
* Model 8: ~70%
* Model 10: ~23%
* Model 12: ~74%
* Model 14: ~58%
* Model 16: ~73%
* Model 21: ~68%
* **Tau2-bench Airline (Pink):** This line is relatively flat, with a slight upward trend.
* Model 4: ~47%
* Model 8: ~50%
* Model 13: ~64%
* Model 16: ~65%
* **Tau-bench Airline (Blue):** This line fluctuates.
* Model 4: ~42%
* Model 11: ~49%
* Model 13: ~50%
* Model 14: ~32%
* Model 16: ~52%
* Model 21: ~50%
* **ComplexFuncBench (Purple):** This line fluctuates significantly.
* Model 4: ~38%
* Model 8: ~50%
* Model 10: ~7%
* Model 13: ~62%
* Model 16: ~20%
### Key Observations
* "Tau2-bench Telecom" shows the most significant performance increase as the model number increases.
* "ComplexFuncBench" has the most volatile performance across different model numbers.
* "Tau2-bench Retail" and "Tau2-bench Airline" show relatively stable and high performance.
* "Tau-bench Retail" and "Tau-bench Airline" show more fluctuation than "Tau2-bench Retail" and "Tau2-bench Airline".
### Interpretation
The chart compares the performance of different models or benchmarks across a range of model numbers. The "Tau2-bench Telecom" model demonstrates a clear upward trend, suggesting it benefits the most from increasing model complexity or iteration. "ComplexFuncBench" shows highly variable performance, indicating it may be sensitive to specific model architectures or configurations. The other models show relatively stable performance, with "Tau2-bench Retail" and "Tau2-bench Airline" consistently achieving higher scores than "Tau-bench Retail" and "Tau-bench Airline". The "Tau" vs "Tau2" prefixes may indicate different versions or configurations of the same underlying model type. The data suggests that for the "Telecom" benchmark, the "Tau2" version is significantly better than the "Tau" version, while for "Retail" and "Airline" the "Tau2" versions are only marginally better.