TECHNICAL ASSET FINGERPRINT
0e030ff08f5b6c91248deeba
Click to view fullscreen
Press ESC or click to close
FOUND IN PAPERS
EXPERT: gemini-3.1-pro-preview VERSION 1
RUNTIME: gemini/gemini-3.1-pro-preview
INTEL_VERIFIED
## Line Chart: Model Performance Scores Across Various Benchmarks
### Overview
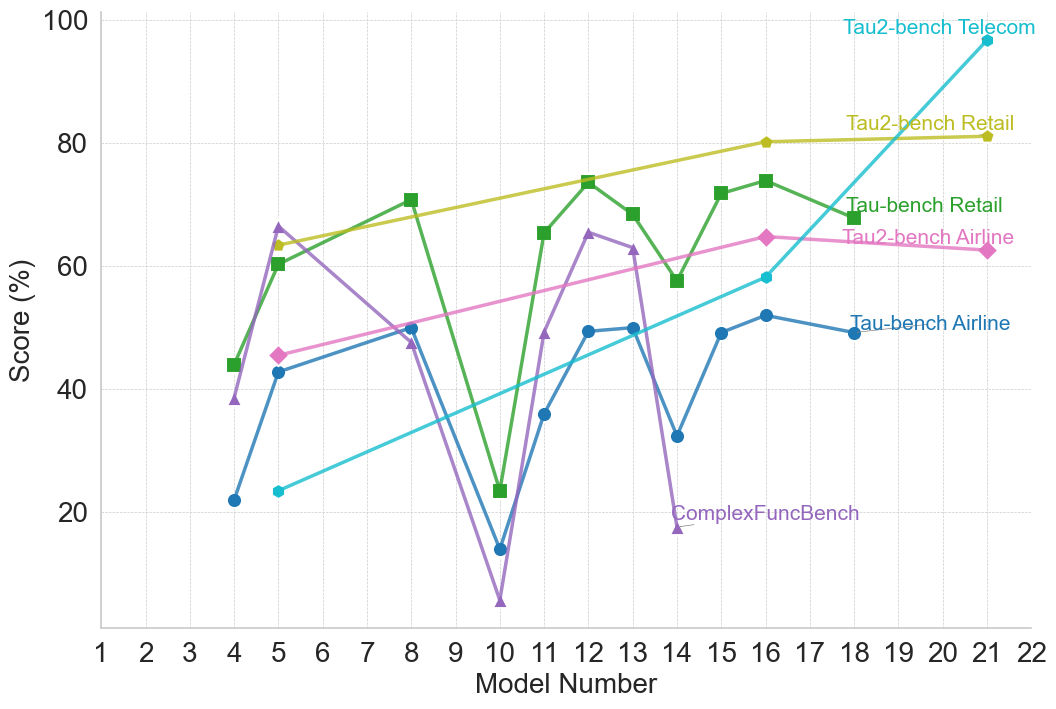
This image is a line chart displaying the performance scores (in percentages) of various numbered models across six different benchmark tests. The chart illustrates how performance evolves or fluctuates across different model iterations or variants, highlighting significant volatility in certain benchmarks and smoother progression in others.
### Components/Axes
**1. Y-Axis (Left):**
* **Label:** "Score (%)" (Rotated 90 degrees counter-clockwise).
* **Scale:** Ranges from 0 to 100 (though 0 is not explicitly marked, the axis starts below 20).
* **Major Ticks:** 20, 40, 60, 80, 100.
* **Gridlines:** Solid light gray horizontal lines at major ticks. Dashed light gray horizontal lines at midpoints (10, 30, 50, 70, 90).
**2. X-Axis (Bottom):**
* **Label:** "Model Number" (Centered below the axis).
* **Scale:** Discrete integer values from 1 to 22.
* **Major Ticks:** 1, 2, 3, 4, 5, 6, 7, 8, 9, 10, 11, 12, 13, 14, 15, 16, 17, 18, 19, 20, 21, 22.
* **Gridlines:** Dashed light gray vertical lines extending upward from each integer tick.
**3. Legend/Labels:**
There is no separate legend box. Instead, the labels for each data series are placed directly on the chart area, generally positioned to the right side near the final data points of their respective lines. The text color matches the line color.
### Detailed Analysis
The chart contains six distinct data series. Notably, the data density varies; three series have data points for many models, while three series only have data points for Models 5, 16, and 21.
**Series 1: Tau2-bench Telecom**
* **Visual Identification:** Cyan line, pentagon/diamond markers. Label located at the top right.
* **Trend Verification:** The line slopes upward steadily from its first point to its second, and then slopes upward sharply to its final point, representing the highest score on the chart.
* **Data Points (Approximate ±2%):**
* Model 5: 23%
* Model 16: 58%
* Model 21: 97%
**Series 2: Tau2-bench Retail**
* **Visual Identification:** Olive/gold line, small circle markers. Label located in the upper right.
* **Trend Verification:** The line starts relatively high, slopes upward gradually to the middle point, and then flattens out, showing almost no growth between the last two points.
* **Data Points (Approximate ±2%):**
* Model 5: 63%
* Model 16: 80%
* Model 21: 81%
**Series 3: Tau-bench Retail**
* **Visual Identification:** Green line, square markers. Label located in the mid-upper right.
* **Trend Verification:** Highly volatile. Starts mid-range, rises, experiences a massive drop at Model 10, recovers sharply, fluctuates slightly, and ends relatively high.
* **Data Points (Approximate ±2%):**
* Model 4: 44%
* Model 5: 60%
* Model 8: 71%
* Model 10: 23%
* Model 11: 65%
* Model 12: 74%
* Model 13: 68%
* Model 14: 58%
* Model 15: 72%
* Model 16: 74%
* Model 18: 68%
**Series 4: Tau2-bench Airline**
* **Visual Identification:** Pink line, diamond markers. Label located in the mid-right.
* **Trend Verification:** Starts mid-range, slopes upward gradually to the middle point, and then exhibits a very slight downward slope to the final point.
* **Data Points (Approximate ±2%):**
* Model 5: 45%
* Model 16: 65%
* Model 21: 63%
**Series 5: Tau-bench Airline**
* **Visual Identification:** Dark blue line, circle markers. Label located in the mid-lower right.
* **Trend Verification:** Volatile, mirroring the shape of Tau-bench Retail but at a lower score tier. Rises initially, drops sharply at Model 10, recovers, dips again at Model 14, and stabilizes in the middle range.
* **Data Points (Approximate ±2%):**
* Model 4: 22%
* Model 5: 43%
* Model 8: 50%
* Model 10: 14%
* Model 11: 36%
* Model 12: 49%
* Model 13: 50%
* Model 14: 32%
* Model 15: 49%
* Model 16: 52%
* Model 18: 49%
**Series 6: ComplexFuncBench**
* **Visual Identification:** Purple line, triangle markers. Label located in the lower right.
* **Trend Verification:** Extremely volatile. Starts mid-low, spikes high, crashes to near-zero at Model 10, recovers sharply, and crashes again at Model 14.
* **Data Points (Approximate ±2%):**
* Model 4: 38%
* Model 5: 66%
* Model 8: 47%
* Model 10: 5%
* Model 11: 49%
* Model 12: 65%
* Model 13: 63%
* Model 14: 17%
### Key Observations
1. **The "Model 10" Anomaly:** There is a severe, synchronized drop in performance at Model 10 across all three benchmarks that evaluated it (Tau-bench Retail, Tau-bench Airline, ComplexFuncBench). ComplexFuncBench drops to nearly 0%.
2. **The "Model 14" Dip:** A secondary, less severe synchronized drop occurs at Model 14 for the same three benchmarks.
3. **Evaluation Discrepancy:** The "Tau2" benchmarks (Telecom, Retail, Airline) were only evaluated on Models 5, 16, and 21. The "Tau" benchmarks and ComplexFuncBench were evaluated on a much denser cluster of models (4, 5, 8, 10-16, 18).
4. **Highest/Lowest Performers:** Model 21 on Tau2-bench Telecom achieved the highest score (~97%). Model 10 on ComplexFuncBench achieved the lowest score (~5%).
### Interpretation
The data suggests a comparison of a family of models (likely sequential versions or varying parameter sizes, given the numerical x-axis) against a suite of tasks.
**Reading Between the Lines (Peircean Investigative Analysis):**
* **Model 10 is Broken:** The catastrophic failure of Model 10 across all tested benchmarks strongly implies a fundamental flaw in that specific model's training run, architecture, or alignment, rather than a difficulty with a specific benchmark. It lost almost all capability to perform complex functions.
* **Tau vs. Tau2:** The naming convention suggests "Tau2" is a newer or revised version of the "Tau" benchmarks. The fact that Tau2 was only run on Models 5, 16, and 21 suggests these might be "milestone" models or final release candidates, whereas the denser testing on the older "Tau" benchmarks represents internal testing during the iterative development process (Models 8 through 15).
* **Illusion of Smoothness:** The Tau2 lines appear much smoother and show a clearer upward trajectory. However, this is an artifact of low data density. Because they skip the volatile middle models (like the broken Model 10 and the dip at 14), they draw a straight line over what might actually be a bumpy progression.
* **Overall Progress:** Despite the severe regressions at Models 10 and 14, the general trend from left to right is positive. The later models (16, 18, 21) generally outperform the earlier models (4, 5), indicating that the development process is ultimately yielding more capable systems, particularly in Telecom and Retail domains.
DECODING INTELLIGENCE...