## Line Chart: Model Performance on Benchmarks
### Overview
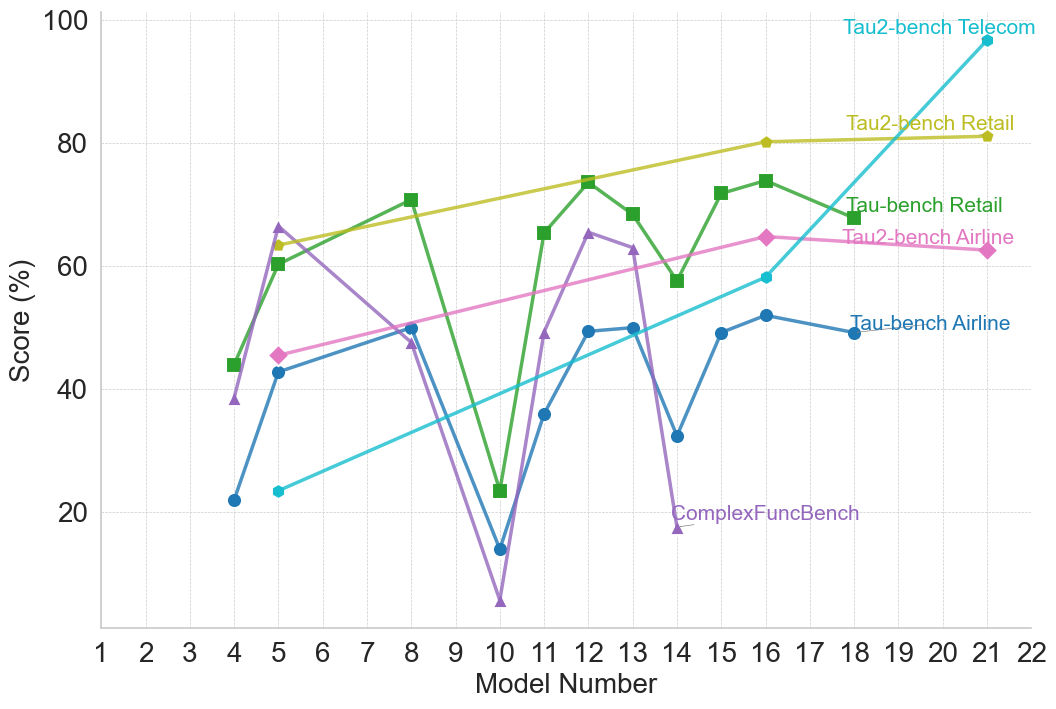
This line chart displays the performance scores of different models across several benchmarks. The x-axis represents the model number, ranging from 1 to 22. The y-axis represents the score, expressed as a percentage, ranging from 0 to 100. Six different benchmarks are represented by distinct colored lines.
### Components/Axes
* **X-axis:** Model Number (1 to 22)
* **Y-axis:** Score (%) (0 to 100)
* **Benchmarks (Lines/Legend):**
* Tau2-bench Telecom (Cyan)
* Tau2-bench Retail (Yellow)
* Tau2-bench Airline (Magenta)
* Tau-bench Airline (Purple)
* Tau-bench Retail (Olive)
* ComplexFuncBench (Teal)
The legend is located in the top-right corner of the chart. The gridlines are present, aiding in reading the values.
### Detailed Analysis
Here's a breakdown of each benchmark's performance trend and approximate data points:
* **Tau2-bench Telecom (Cyan):** This line generally slopes upward, starting at approximately 20% at Model 4, reaching a peak of around 95% at Model 22. There's a slight dip between Model 11 and 13, falling to approximately 40%.
* **Tau2-bench Retail (Yellow):** This line shows a relatively stable performance, starting around 65% at Model 4, peaking at approximately 82% around Model 8, and then decreasing slightly to around 75% at Model 22.
* **Tau2-bench Airline (Magenta):** This line starts at approximately 60% at Model 4, increases to around 70% at Model 8, then decreases to approximately 50% at Model 11, and rises again to around 70% at Model 22.
* **Tau-bench Airline (Purple):** This line begins at approximately 45% at Model 4, decreases sharply to a minimum of around 10% at Model 11, and then increases to approximately 50% at Model 22.
* **Tau-bench Retail (Olive):** This line starts at approximately 40% at Model 4, increases to around 65% at Model 8, decreases to approximately 40% at Model 11, and then rises to around 60% at Model 22.
* **ComplexFuncBench (Teal):** This line starts at approximately 20% at Model 4, increases to around 45% at Model 8, decreases to approximately 30% at Model 13, and then rises to around 50% at Model 22.
### Key Observations
* **Tau2-bench Telecom** consistently outperforms all other benchmarks, especially in the later models (16-22).
* **Tau-bench Airline** exhibits the most volatile performance, with a significant drop around Model 11.
* **Tau2-bench Retail** shows the most stable performance across all models.
* All benchmarks show an overall increasing trend in performance as the model number increases, suggesting model improvement.
* The lowest scores are consistently observed for **Tau-bench Airline** and **ComplexFuncBench**, particularly in the earlier models.
### Interpretation
The chart demonstrates the performance of different models across a variety of benchmarks. The significant difference in performance between the benchmarks suggests that the models are better suited for certain tasks than others. The upward trend in scores across all benchmarks indicates that the models are improving with increasing model number, likely due to increased complexity or training data. The large drop in performance for Tau-bench Airline around Model 11 could indicate a specific weakness in the model's architecture or training data related to that benchmark. The consistent high performance of Tau2-bench Telecom suggests that the models are particularly effective at tasks related to telecommunications. The data suggests a trade-off between stability and peak performance; Tau2-bench Retail is stable, while Tau2-bench Telecom achieves higher scores but with more variability. The benchmarks likely represent different levels of complexity or different types of data, explaining the varying performance levels.