## Line Chart: Accuracy vs. Model Size
### Overview
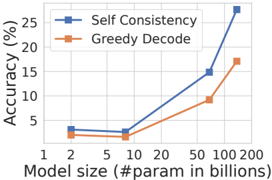
This chart illustrates the performance comparison between two decoding strategies—"Self Consistency" and "Greedy Decode"—across four different Large Language Model (LLM) sizes. The chart demonstrates that accuracy generally improves as the model size increases, with "Self Consistency" consistently outperforming "Greedy Decode" across all tested scales.
### Components/Axes
* **Y-Axis:** Labeled "Accuracy (%)". It is a linear scale ranging from 0 to 25+, with major grid lines at intervals of 5.
* **X-Axis:** Labeled "Model size (#param in billions)". It is a logarithmic scale with major markers at 1, 2, 5, 10, 20, 50, 100, and 200.
* **Legend:** Located in the top-left corner.
* **Blue line with square markers:** "Self Consistency"
* **Orange line with square markers:** "Greedy Decode"
### Detailed Analysis
The chart plots four distinct data points for each series, corresponding to approximate model sizes of 2B, 8B, 70B, and 140B parameters.
**Trend Verification:**
Both data series exhibit a similar trend: a slight, negligible decline or stagnation between the first two data points (2B to 8B), followed by a sharp, accelerating upward slope as the model size increases from 8B to 140B.
**Data Extraction (Approximate Values):**
| Model Size (Approx.) | Self Consistency (Blue) | Greedy Decode (Orange) |
| :--- | :--- | :--- |
| **~2 Billion** | ~3.5% | ~2.5% |
| **~8 Billion** | ~3.0% | ~2.0% |
| **~70 Billion** | ~15.0% | ~9.0% |
| **~140 Billion** | ~27.5% | ~17.0% |
*Note: Values are estimated based on visual alignment with the grid lines. The 140B point for Self Consistency exceeds the 25% grid line.*
### Key Observations
* **Performance Gap:** The absolute difference in accuracy between the two methods increases significantly as the model size grows. At 2B parameters, the gap is ~1%. At 140B parameters, the gap widens to ~10.5%.
* **Scaling Threshold:** There is a clear "knee" in the curve around the 8B-10B parameter mark. Below this threshold, accuracy is low and stagnant. Above this threshold, scaling the model size yields substantial, non-linear improvements in accuracy.
* **Consistency:** "Self Consistency" is the superior decoding strategy at every tested scale.
### Interpretation
The data demonstrates a classic "scaling law" effect in Large Language Models, where performance gains are not linear but accelerate as the model size increases.
The widening gap between the two lines suggests that "Self Consistency" (a technique that typically involves sampling multiple outputs and selecting the most frequent answer) scales more effectively with larger model capacity than "Greedy Decode" (which selects the single most likely token). This implies that larger models are better at generating a diverse and correct set of reasoning paths, which "Self Consistency" can then leverage to improve final accuracy. The slight dip in performance between 2B and 8B parameters is an anomaly that might suggest that at very small scales, the models are too weak to benefit from either decoding strategy, or that there is a specific architectural transition occurring between these sizes.